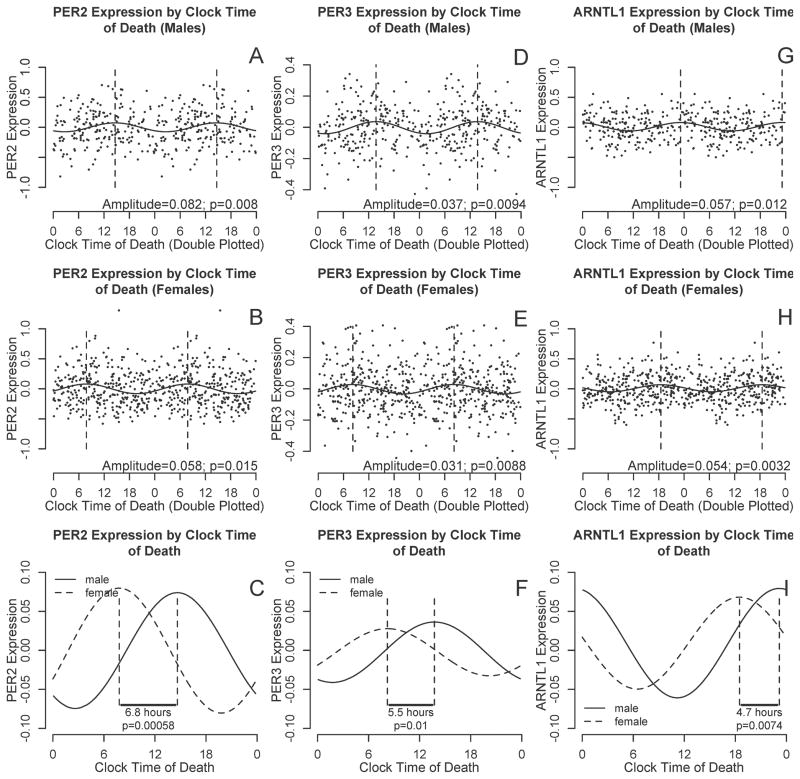
Figure 3. PER2, PER3, and ARNTL1 transcript abundance by clock time of death, stratified by sex.
A–B, D–E, and G–I. PER2, PER3, and ARNTL1 abundance double plotted against clock time for males (A,D,F) and females (B,E,I). Data are binned into 4 hour windows. Horizontal lines indicate means and 95% confidence intervals of the means, the solid curve is the best-fit cosine curve, and dotted lines indicate acrophase. C, F, I. Difference in acrophase timing between male (solid line) and female (dashed line) best fit cosine curves for PER2, PER3, and ARNTL1 abundance as a function of clock time of death, adjusted for age and postmortem interval. A–B, D–E, and G–I show raw data and best fit curves unadjusted for age and postmortem intervals. C, F, I show best-fit curves adjusted for age and postmortem interval.

