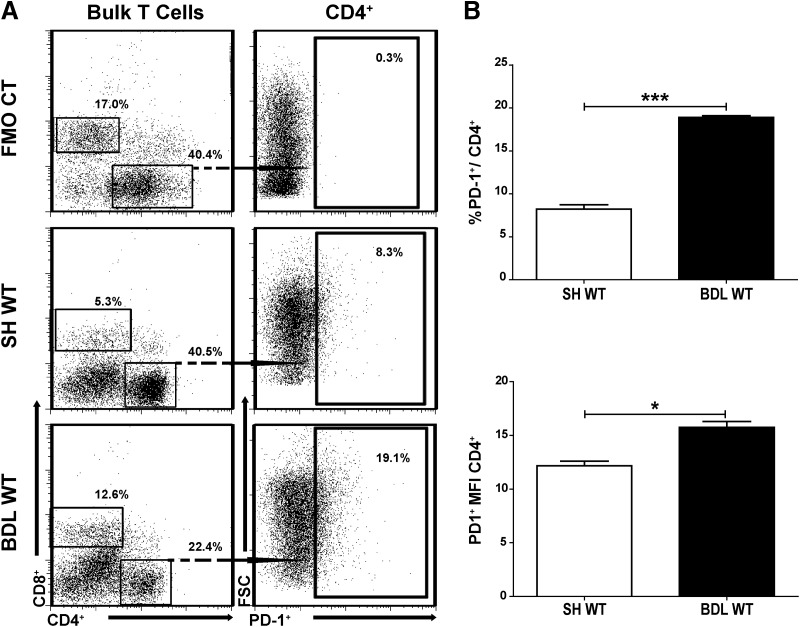
Figure 1. Increased expression of PD-1 among LTCs.
BDL was performed in WT C57Bl/6 mice, and 7 days later, LTCs were collected using immunomagnetic beads specific for Thy1.2. PD-1 (CD279) expression among CD4+ LTCs was measured by flow cytometry (A). PD-1 expression among CD4+ LTCs is shown (B). CT, Control; FSC, forward-scatter. Means ± sem are shown, based on triplicate samples, with each sample pooled from two to three livers. Data shown are representative of greater than three independent experiments, ***P ≤ 0.001; *P ≤ 0.05.

