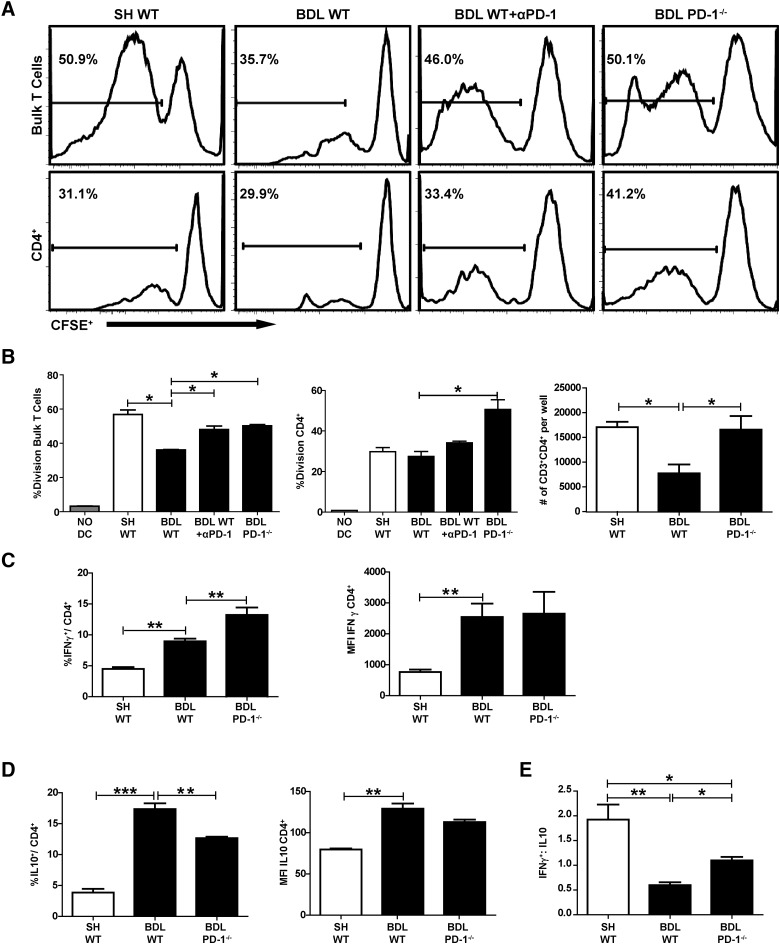
Figure 2. Loss of PD-1 signaling restores LTC proliferation.
LTCs were labeled with CFSE and stimulated with allogeneic CD11c+ splenocytes. Division of bulk and CD4+ LTC was assessed using flow cytometry to determine the degree of CFSE loss. Gates were drawn based on the division of unstimulated T cell controls (A). Absolute numbers of CD4+ T cells calculated from experimental wells at the end of the assay (B). LTCs, isolated 7 days following BDL, were stimulated overnight, and IFN-γ expression among CD4+ T cells was measured by intracellular staining and flow cytometry (C). Intracellular production of IL-10 was measured by the same method (D), and the ratio of IFN-γ:IL-10 expressing T cells was calculated (E). The histograms are single samples, each comprised of two to three pooled livers. The data in A–E are representative of a minimum of three independent experiments. αPD-1, Anti-PD-1; MFI, mean fluorescence intensity. Means ± sem derived from greater than or equal to three samples/experiment, *P ≤ 0.05; **P ≤ 0.01; ***P ≤ 0.001.

