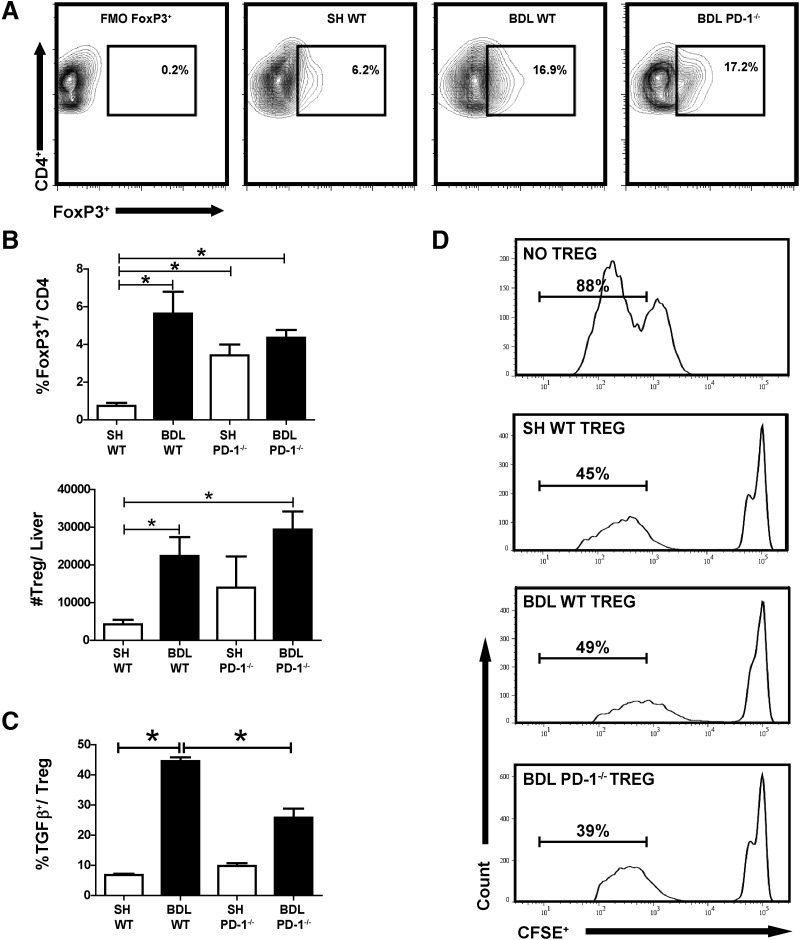
Figure 3. PD-1 is not essential for liver Treg expansion and suppressive function following BDL.
Treg populations (CD3+CD4+FoxP3+) in Thy1.2+ LTCs were measured by flow cytometry from WT and PD-1−/− animals (A). The absolute number of Tregs was calculated (B). Treg expression of TGF-β was measured by intracellular staining (C). FACS-sorted purified liver CD3+CD4+CD25+ cells from WT and PD-1−/− were added to MLR reactions consisting of WT CFSE-labeled splenic T cell responders and allogeneic CD11c+ stimulators. Proliferation was measured by flow cytometry on Day 6, based off of stimulated control wells that lacked suppressors. Data are representative of at least two separate repetitions with comparable results (D). The contour plot in A is a representative example compiled from two to three pooled livers. FoxP3 and TGF-β graphs were compiled from three separate, independent experiments with comparable results, with ≥10 samples/group, *P ≤ 0.05.

