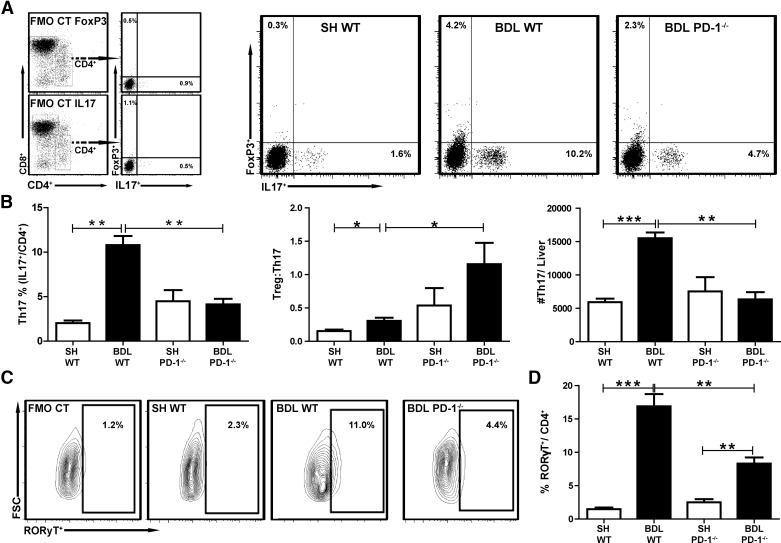
Figure 4. Loss of PD-1 signaling prevents expansion of liver Th17 cells following BDL.
Liver Thy1.2+ cells were isolated, and the Treg (CD3+CD4+FoxP3+IL-17−) or Th17 (CD3+CD4+FoxP3−IL-17+) populations were measured by flow cytometry. Gates were drawn based on FMO controls (A). Treg and Th17 cells were quantified following BDL in WT and PD-1−/− mice (B). The Treg:Th17 ratio was also calculated from percent Treg and Th17 of CD4+ T cells. Absolute counts of Th17 cells were calculated/experimental liver. Intracellular RORγT (RORyT+) production was also measured (C and D). All data are representative of at least three separate repetitions with comparable results. Bar graphs illustrate means ± sem, *P ≤ 0.05; **P ≤ 0.01; ***P ≤ 0.001.

