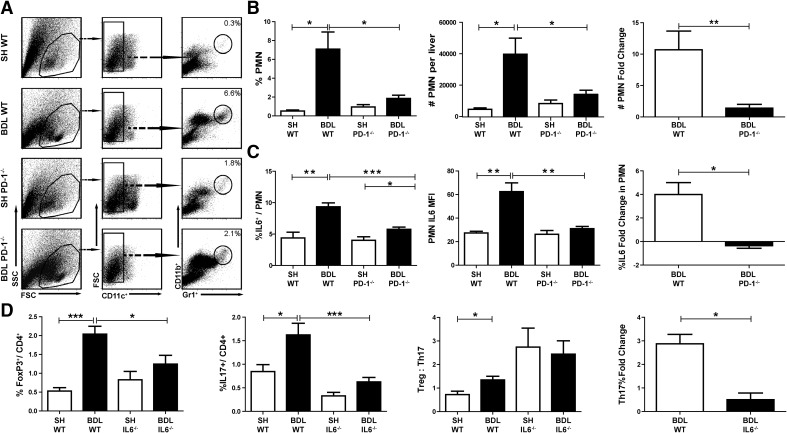
Figure 6. Intrahepatic Th17 cell accumulation and inflammation are driven by PD-1 and IL-6.
CD45+ liver NPCs were purified, and neutrophils (CD11b+Gr1HICD11c−) were quantified by flow cytometry (A). The percent and absolute numbers of neutrophils among liver leukocytes were measured. The fold change from SH livers was also calculated (B). The percentages of neutrophils expressing IL-6 and the IL-6 mean fluorescence intensity were determined by intracellular cytokine staining following stimulation with CpG. The fold change in neutrophil IL-6 production following BDL for each strain is shown (C). The effect of IL-6−/− on liver Treg and Th17 population dynamics following BDL was measured. The ratio of Treg:Th17 cells and the Th17 fold change in WT and IL-6−/− mice are shown (D). SSC, Side-scatter. The flow data are pooled from two to three livers/experimental sample, with three to six samples/group. Bar graphs are representative of a single representative experiment repeated at least three times, *P ≤ 0.05; **P ≤ 0.01; ***P ≤ 0.001.

