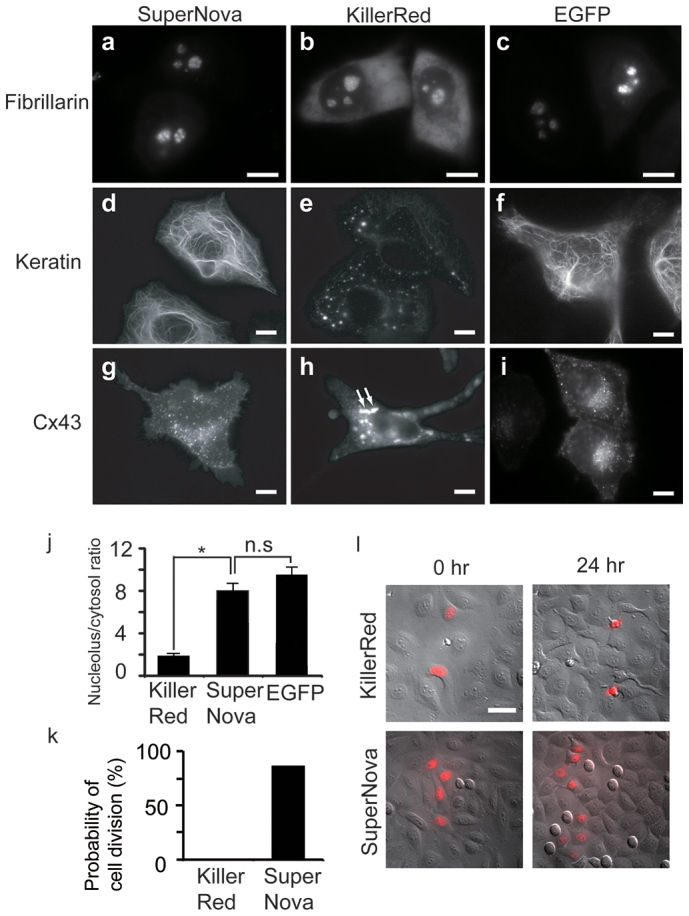
Figure 3. Expression patterns of SuperNova, KillerRed or EGFP fusion proteins in HeLa cells.

(a–c) fibrillarin, (d–f), keratin or (g–i) Cx43 fused with KillerRed (a, d and g), SuperNova (b, e and h) or EGFP (c, f and i), respectively. Scale bar, 10 μm. (j) Quantitative analysis of localization of fibrillarin fused with KillerRed, SuperNova or EGFP. Fluorescence intensity ratios between nucleolus and cytosol are indicated. (k) The probability of cell division during 24 hours is shown for HeLa cells expressing KillerRed-H2B or SuperNova-H2B following time lapse imaging. (l) Merged images of the differential interference contrast and the fluorescence analyzed in (k). Scale bar, 50 μm.
