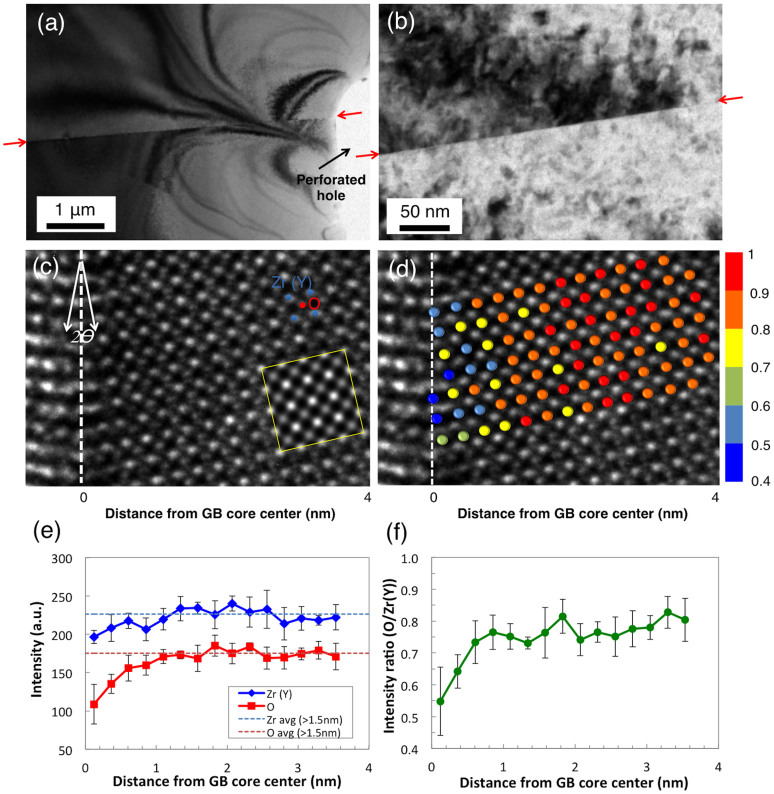
Figure 1. Bright-field TEM images of near-GB area investigated in this study within the range of (a) ~ 6 μm and (b) ~ 300 nm of GB.
GBs are marked with red arrows on both sides. (c) Aberration-corrected TEM image taken at negative-Cs condition near Σ13(510)/[001] GB (white-dotted line) of bicrystal YSZ showing perfect registry with the simulated image in yellow inset. (d) The same aberration-corrected TEM image with oxygen columns in color code corresponding to their normalized image intensity (normalized by maximum oxygen column intensity). (e) Intensities of individual atomic columns. (f) Column intensity ratio (O/Zr) as a function of distance away from the center of the GB core (x = 0). 6 columns were counted for each data point. The error bar size is 1-standard deviation.

