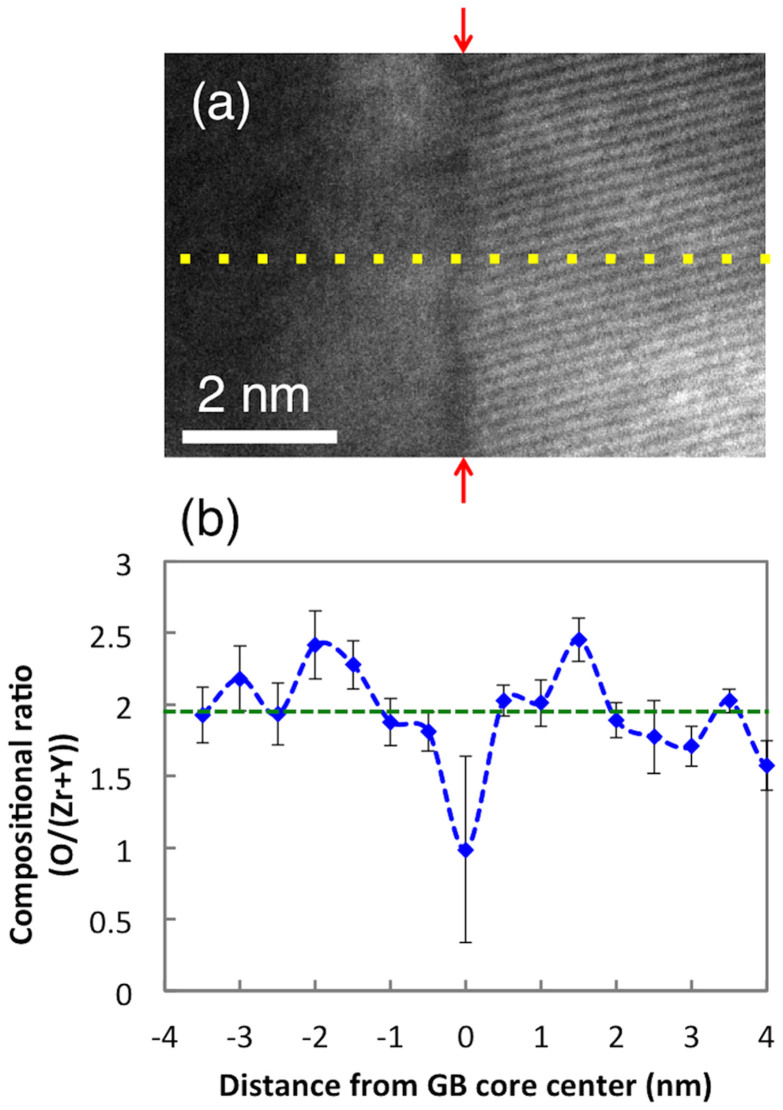
Figure 2.
(a) STEM image near the GB of the bicrystal YSZ. The yellow-dotted line represents the profiling line of the STEM probe for EELS measurements. The GB is marked with red arrows on both sides. (b) Variation of compositional ratio (O/(Zr + Y)) away from the center of the GB core determined by STEM-EELS with a probe size of 0.5 nm. The compositional ratio in the bulk (1.93 in 8 mol% doped YSZ) is shown by the green-dotted line. 10 measurements were conducted for each data point. The error bar size is 1-standard deviation.

