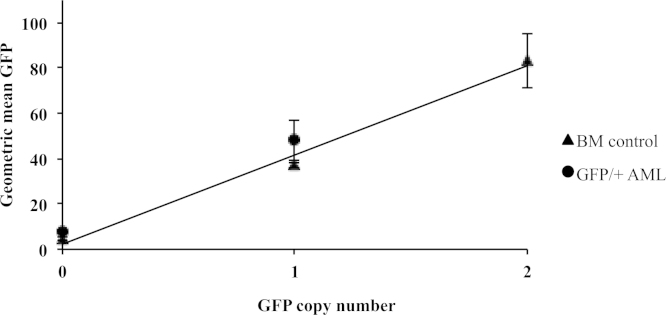
Supplementary Figure 1. Correlation between geometric mean of GFP expression and GFP copy number in unirradiated BM cells and AMLs. BM: Wild type = 0 GFP copies, GFP +/− = one GFP copy and GFP +/+ = two GFP copies. Six rAML Sfpi1GFP/+ cases with known del2 and GFP copy number status. The geometric mean was taken from the FL1 (GFP) histogram plot determined by flow cytometry analysis, and the GFP copy number in the rAML cases was determined by GFP genotyping (Fig. 5B). In unirradiated bone marrow cells, there is a clear correlation between copy number and GFP expression as the expression in the homozygote is significantly different and about two times higher than in the heterozygote (i.e. GFP +/+ mean = 83.34 vs. GFP +/− mean = 37.16, Student's t-test p = 0.0324). Similarly, the expression level of GFP in rAMLs is depending on the GFP copy being retained or not. In Sfpi1GFP/+AMLs the presence of Del2 means that the copy of GFP can be lost or retained. GFP expression levels obtained by flow cytometry (Sfpi1GFP/+rAML GFP lost, mean = 7.79 vs. Sfpi1GFP/+rAML GFP retained, mean = 48.08) are significantly different from each other (p = 0.008, Student's t test). The geometric mean of GFP expression obtained by flow cytometry in live cells increases linearly with GFP copy number. It is therefore possible to use GFP expression level to distinguish Sfpi1GFP/+rAMLs where Del2 has occurred resulting in a loss of GFP from those where the GFP allele has been retained. Error bars represent the standard deviation between two independent samples (BM) and three independent rAMLs (Three Sfpi1GFP/+rAML with the GFP copy lost, 52.1f, 61.2f, 51.1c and three Sfpi1GFP/+rAML with the GFP copy retained 61.2g, 61.3d, 62.2d).
