Figure 2.

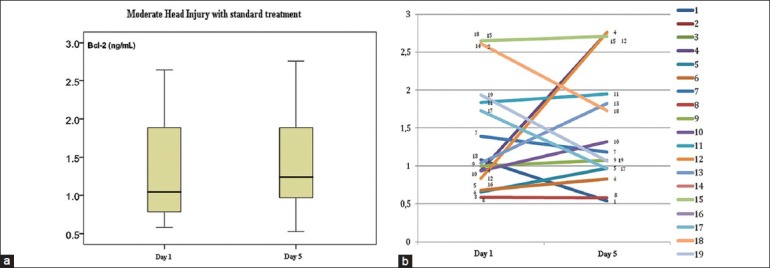
The decrease of Bcl-2 in MHI with standard therapy group after outlier data have been ruled out. (a) Mean spread and standard deviation. (b) Bcl-2 change case by case

The decrease of Bcl-2 in MHI with standard therapy group after outlier data have been ruled out. (a) Mean spread and standard deviation. (b) Bcl-2 change case by case