Figure 7.

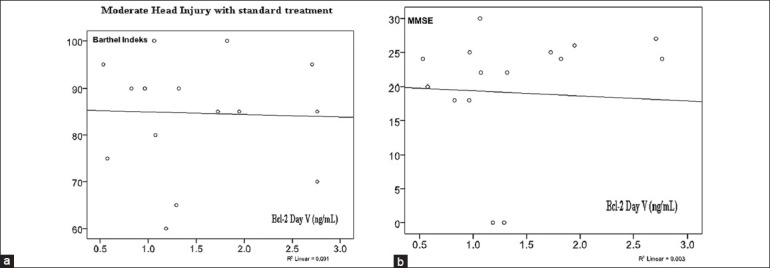
(a) Correlation of serum Bcl-2 concentration on day 5 with Barthel Index (r = 0.034; P = 0.450). (b) Correlation of serum Bcl-2 concentration with MMSE (r = 0.057; P = 0.418)

(a) Correlation of serum Bcl-2 concentration on day 5 with Barthel Index (r = 0.034; P = 0.450). (b) Correlation of serum Bcl-2 concentration with MMSE (r = 0.057; P = 0.418)