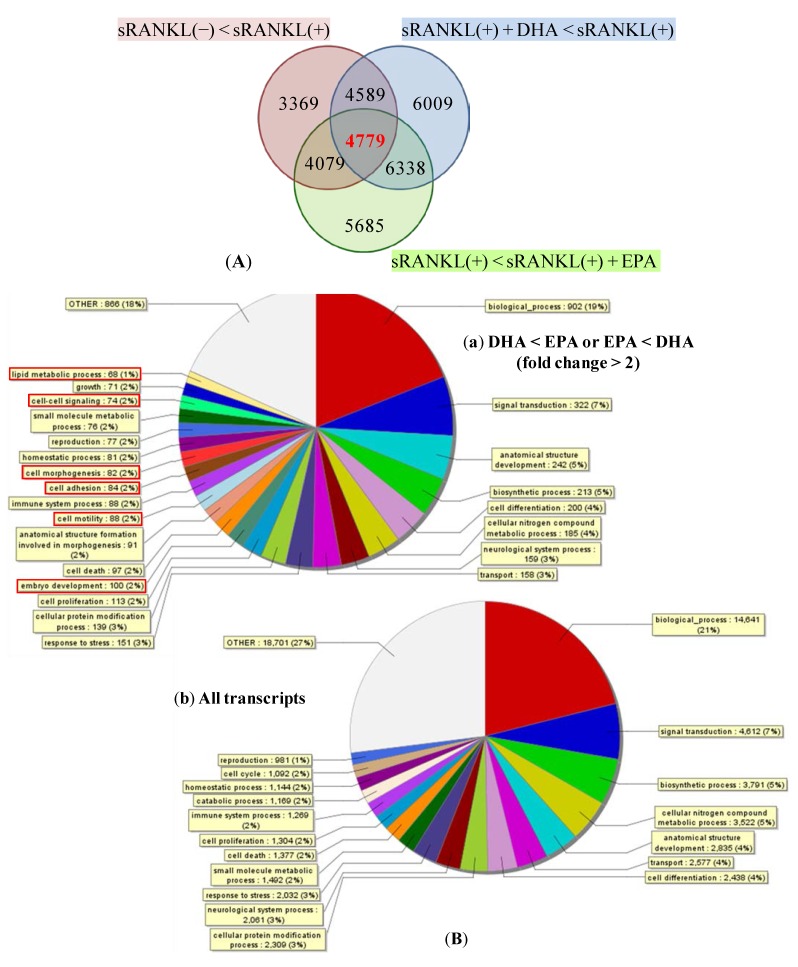
Figure 4.
Genes significantly affected by the DHA or EPA treatment. (A) The Venn diagram shows the grouping of genes with at least two-fold changes. The numbers in the diagram indicate the number of genes. The red circle include genes that were upregulated by sRANKL(+) compared with sRANKL(−), the blue circle include genes that were downregulated by DHA + sRANKL(+) compared with sRANKL(+) and the green circle include genes that were upregulated by sRANKL(+) + EPA compared with sRANKL(+). (B) The pie chart shows GO slim annotation of the differentially expressed transcripts between DHA and EPA (a). All transcripts were shown in (b).

