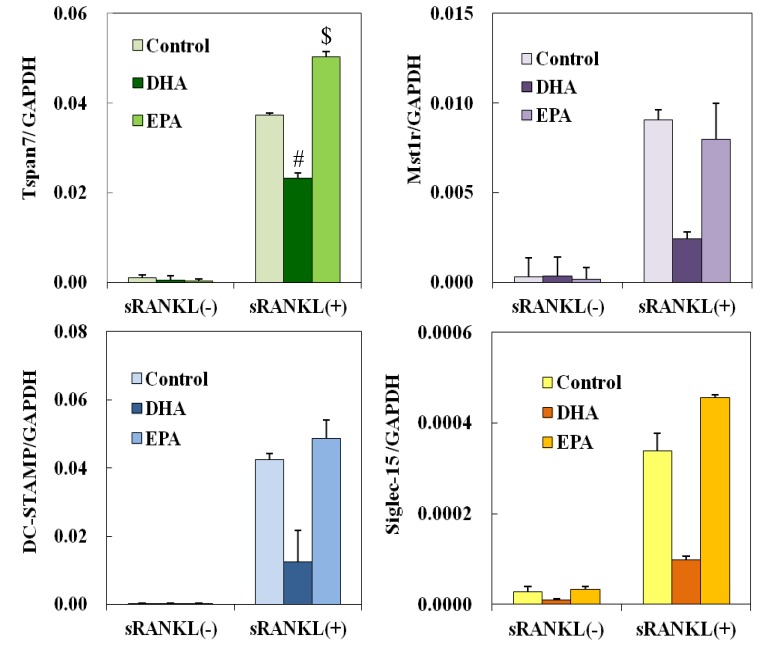
Figure 5.
Effects of EPA on gene expression that was attenuated by the DHA treatment during osteoclastogenesis. DC-STAMP, Tspan7, Siglec-15 and Mst1r mRNA levels were normalized to that of GAPDH. Each column and bar represents the mean ± SE of three mice. # Significantly different from EPA-treated group (p < 0.05) by Tukey-Kramer’s multiple comparison test. $ Significantly different from DHA (p < 0.05) by Tukey-Kramer’s multiple comparison test.

