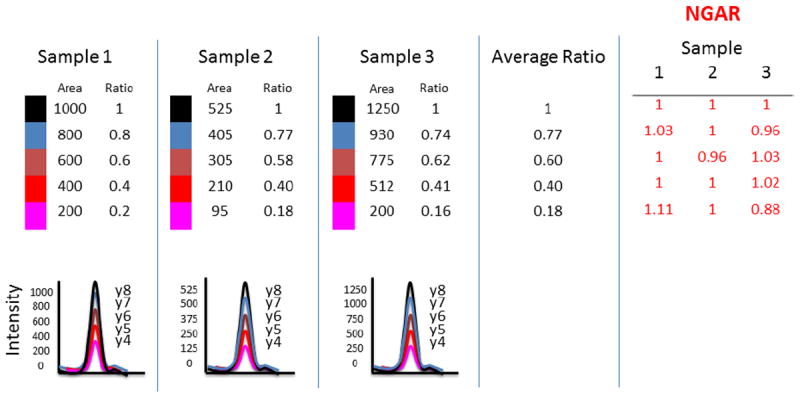
Figure 5.

The diagram depicts how Normalized Group Area Ratio (NGAR) is calculated for a peptide with five MRM transitions over three samples three samples. The NGAR algorithm takes the peak areas for each transition within a run and calculates the ratio of the area of a transition to the area of the first transition for the corresponding group. It then divides by the average of this ratio for all samples (for a given transition). The net result is a NGAR that the reported value should be close to 1.0 if the ratio of a transition to the first is constant across the samples.
