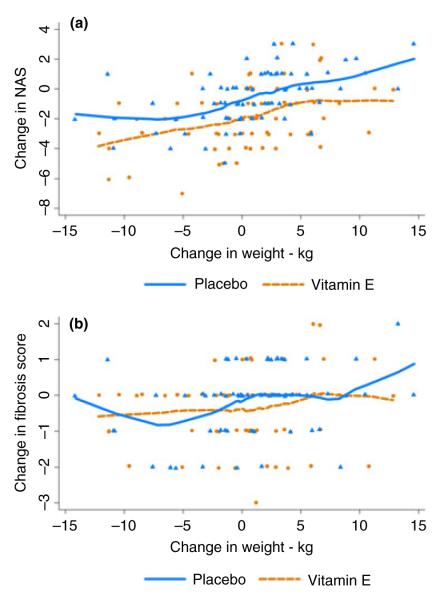
Figure 3.
Change in individual NAS and fibrosis scores between baseline and week 96 in patients receiving vitamin E or placebo by amount of weight change during therapy (a) changes in NAS. (b) changes in fibrosis scores. Each dot represents an individual patient; dots are plotted slightly above or below the line for clarity using 1% jittering; the locally weighted scatterplot smoothing (lowess) curves are present for each group.

