
Figure 7.
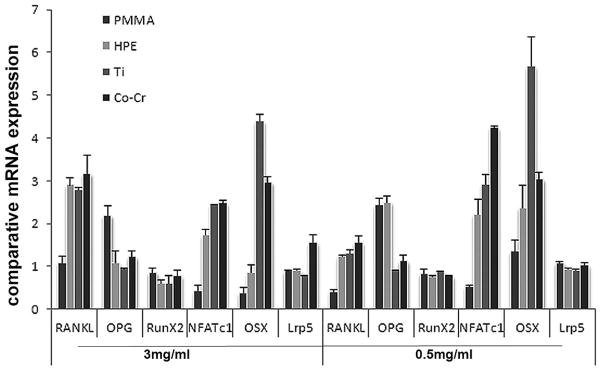
RT-PCR to compare the gene expression profiles among BMSCs groups following variant particles challenges (0.5 or 3mg/ml). The data is expressed as comparative gene copies against readings from no-particle challenged control group (see Materials and methods).