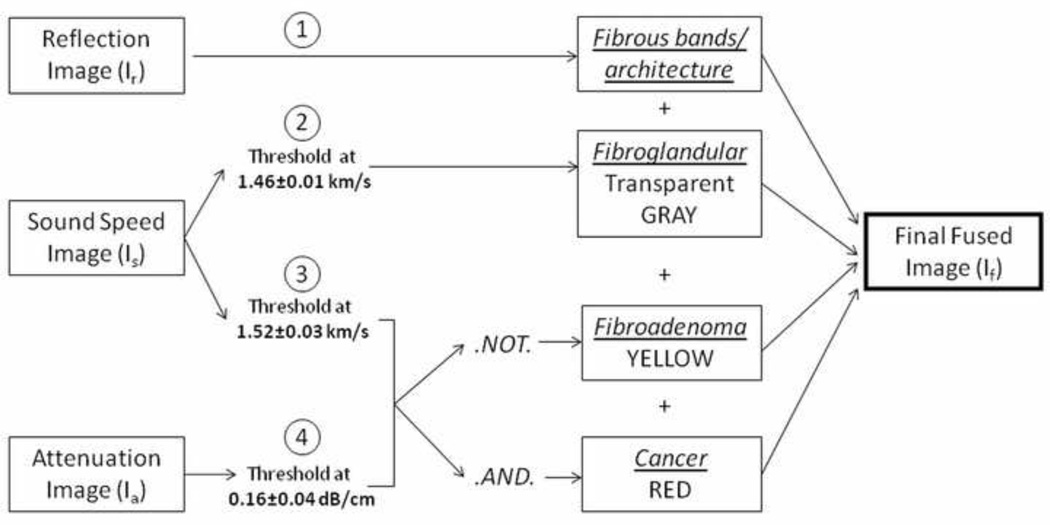
Fig. 1.
Fusion method. First, reflection, sound speed, and attenuation images are obtained from the UST scanner. The reflection image depicts fibrous architecture and is used as the background. The sound speed image is thresholded at two separate instances, once at 1.46±0.01 to show parenchyma and 1.52±0.03 to depict a solid mass. The attenuation image, thresholded at 0.16±0.04, is then added using the logical .AND. and .NOT. operator. The circled numbers represent the steps in image fusion. The final fused image then shows a benign solid mass as yellow, or a cancer as red. Underlines represent tissue estimates.

