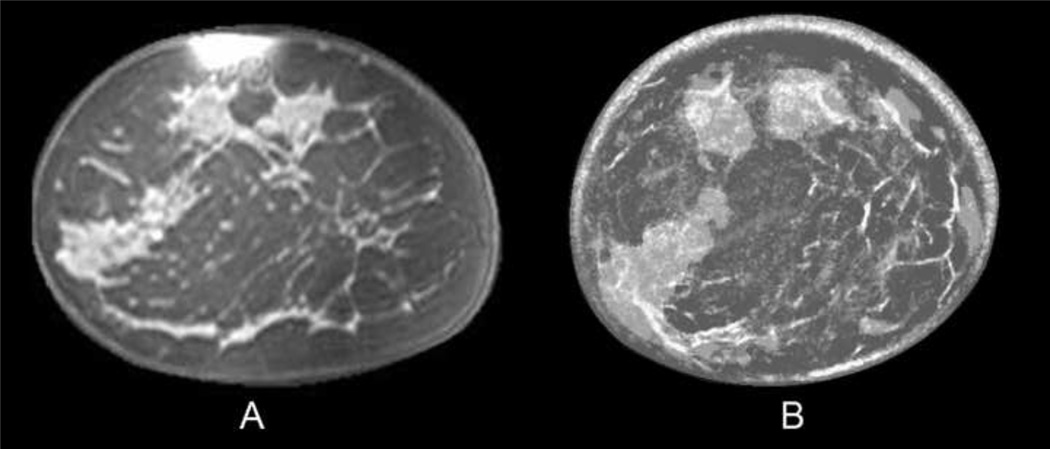
Fig. 2.
Coronal T1, fat-saturated enhanced MR image (A) of a 45-year-old woman with scattered breast density. Fused UST image (B) shows similar anatomic distribution of fibrous bands and overlying fibroglandular tissue, similar to the MR image. The dark gray corresponds to fat, while the semi-transparent lighter gray represents denser fibroglandular tissue with underlying thin white fibrous bands.

