Fig. 5.
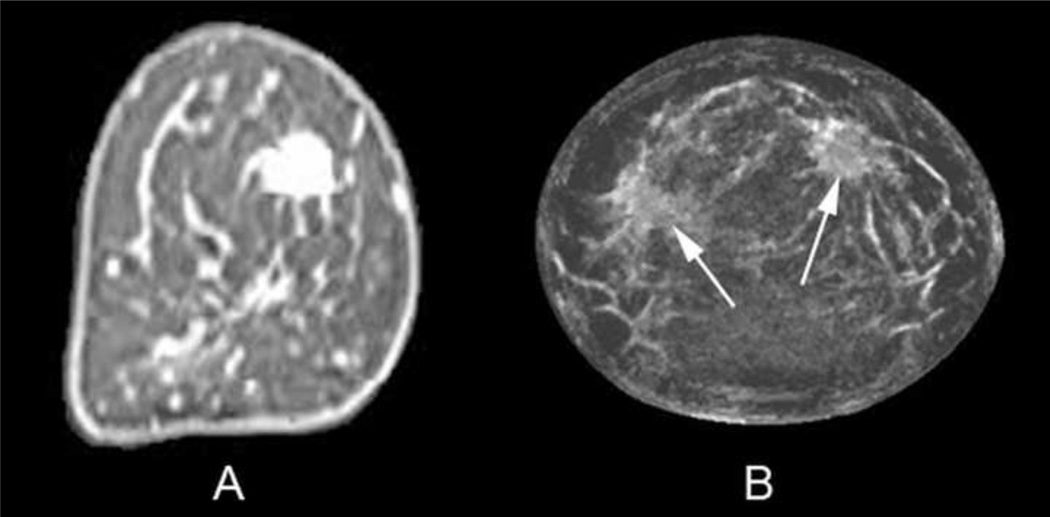
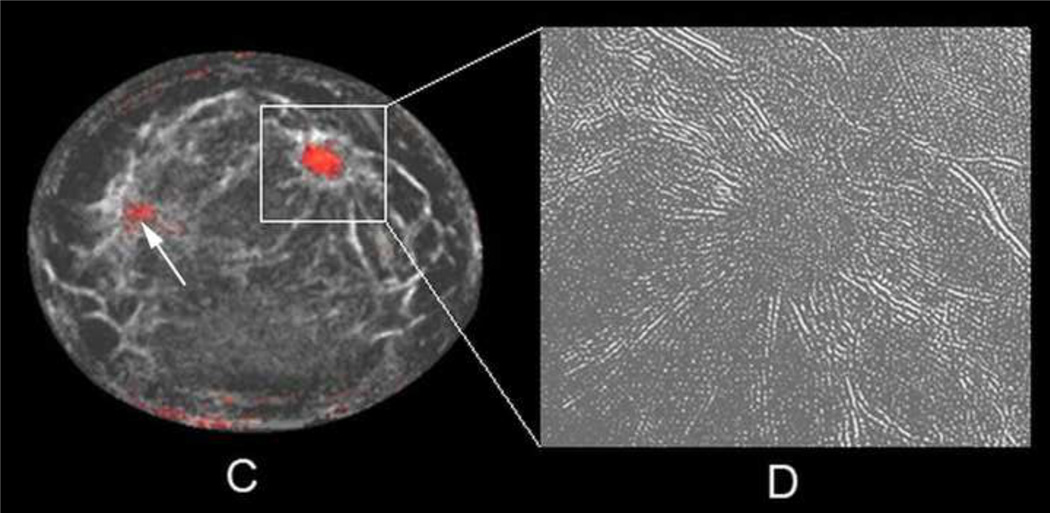
Coronal T1 fat-saturated enhanced MR image (A) of a 56-year-old woman with a 1.7 cm invasive ductal carcinoma in the 1–2 o'clock position showing bright enhancement. Initial fused UST image after step #2 only shows 2 semi-transparent lighter gray regions (arrows) that achieved the first fibroglandular threshold of 1.48 kilometers per second. Final fused UST image (C) using the .AND. operator now produces a red overlay for the mass in the 1–2 o'clock position since it had both high sound speed and attenuation, whereas only a tiny a regular portion of the nine o'clock region surpassed both thresholds (arrow). Some parenchyma and/or fibrous band junctions can incidentally reach threshold (9–10:00 position) but were easily excluded as not having mass effect on several slices. Magnified reflection image using RF component (D) shows distinct mass effect with prominent architectural distortion corresponding to the region around the cancer seen in C.


