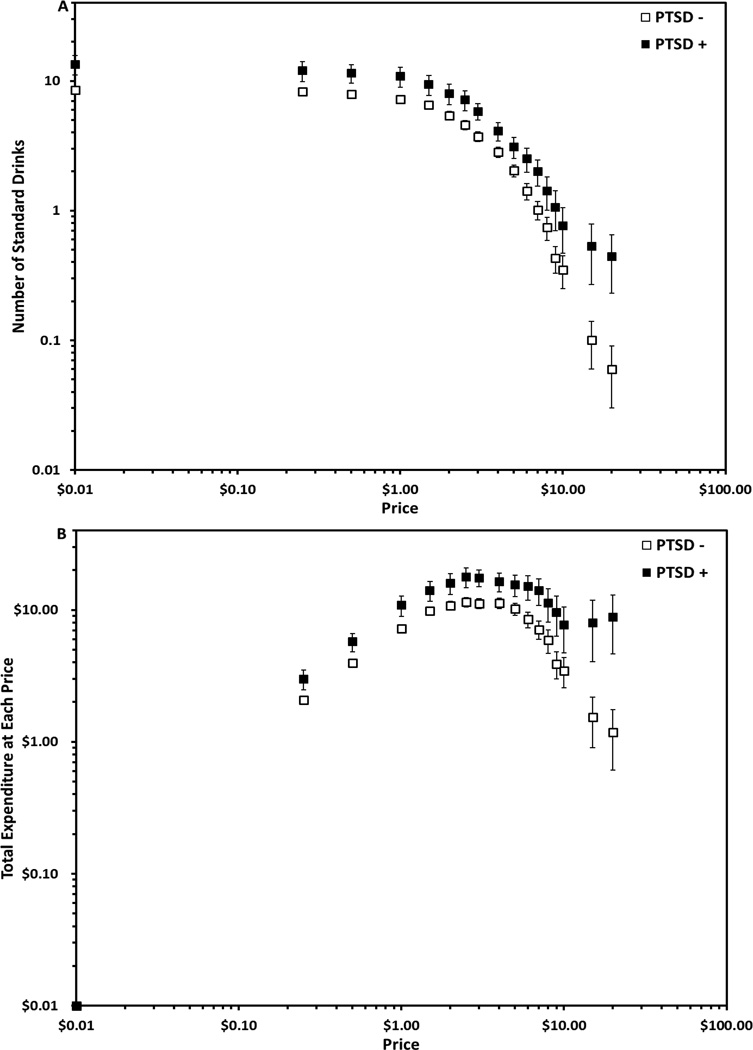
Figure 2.
The top panel depicts the mean (± 1 SEM) number of drinks (hypothetical) that students with (n = 17) and without (n = 69) a PTSD positive screen would purchase as a function of price plotted in conventional double logarithmic coordinates for proportionality. PTSD categories were based on a cut-score of 3 on the PC-PTSD. The bottom panel depicts the mean (± 1 SEM) expenditure on drinks (hypothetical) at each price by students with and without a PTSD positive screen plotted in conventional double logarithmic coordinates for proportionality.

