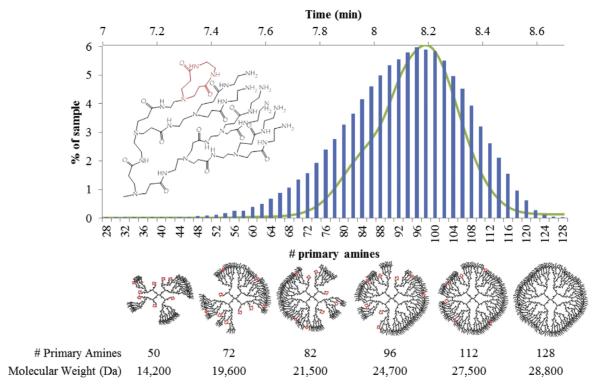
Fig. 6.
CAP2 model histogram (blue bars) overlayed with fraction I UPLC chromatogram at 210 nm. Below, from left to right, the most common structures resulting for various numbers of primary amines and their corresponding molecular weights. (For interpretation of the references to color in this figure legend, the reader is referred to the web version of this article.)

