Figure 1.
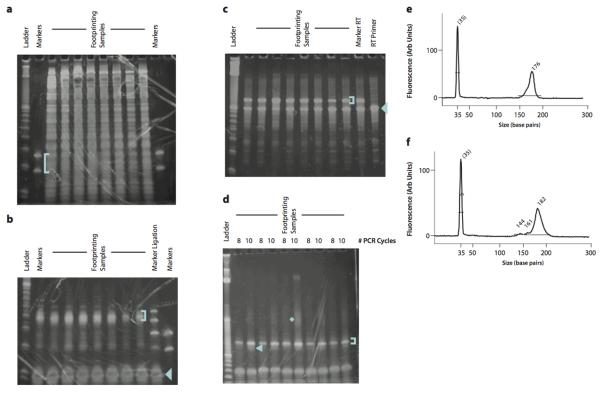
Representative gels from intermediate product purification. (a) Size selection of ribosome footprint fragments. The footprinting samples are derived from HeLa lysates with 5 – 15 μg input RNA. The blue bracket indicates the gel region that should be excised. (b) Purification of ligation products. Two marker samples are shown, one of which contains only the lower and upper marker oligonucleotides, the other of which was produced by carrying forward the markers from the size selection gel through dephosphorylation and ligation. The blue bracket indicates the gel region that should be excised. The blue arrowhead indicates the unreacted linker. (c) Purification of reverse transcription products. The blue bracket indicates the gel band that should be excised. The blue arrowhead indicates the unextended RT primer, which should be avoided. (d) Purification of PCR products. The blue bracket indicates the ~175 nt product band that should be purified. The blue arrowhead indicates the ~145 nt background band derived from unextended RT primer that should be avoided. The blue asterisk indicates the partial duplexes resulting from re-annealing as the PCR amplification approaches saturation. (e) BioAnalyzer profile of a high-quality sequencing library. A single 176 nt peak is present. (f) BioAnalyzer profile of a sequencing library with significant background from unextended RT primer. The background manifests as smaller DNA fragments that comprise 5–10% of the total DNA present in the sample; completely unextended RT primer yields a 144 bp PCR product. The DNA in this peak will produce sequencing data, but the sequence will consist of the linker sequence with no footprint.

