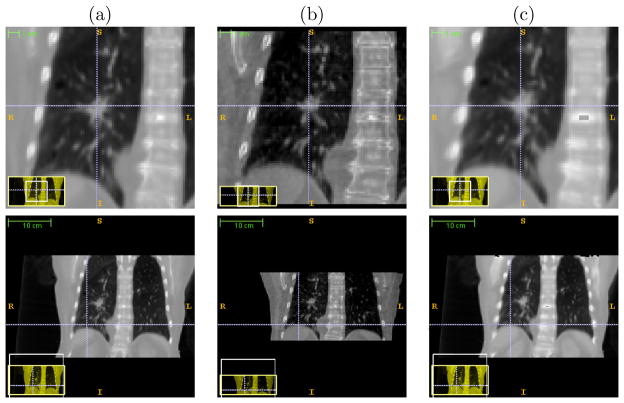
Figure 7.7.
The same 3-space lines in (a) the mean CT, (b) the reconstructed CBCT at the EE phase and (c) the estimated CT of the same lung dataset used in Figure 7.6 (b). Upper row: lines indicate the tumor centroid in the CBCT at the EE phase; lower row: lines indicate the diaphragm contour in the CBCT at the EE phase.

