Figure 7.2.

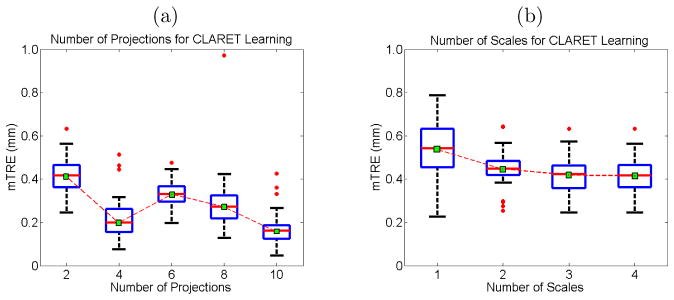
Boxplot results of errors in varying (a) the number of projections used and (b) the number of scales used for CLARET’s rigid registration. Red dots are the outliers. In (a), projections of equally-spaced sources were used.

Boxplot results of errors in varying (a) the number of projections used and (b) the number of scales used for CLARET’s rigid registration. Red dots are the outliers. In (a), projections of equally-spaced sources were used.