
Figure 3.
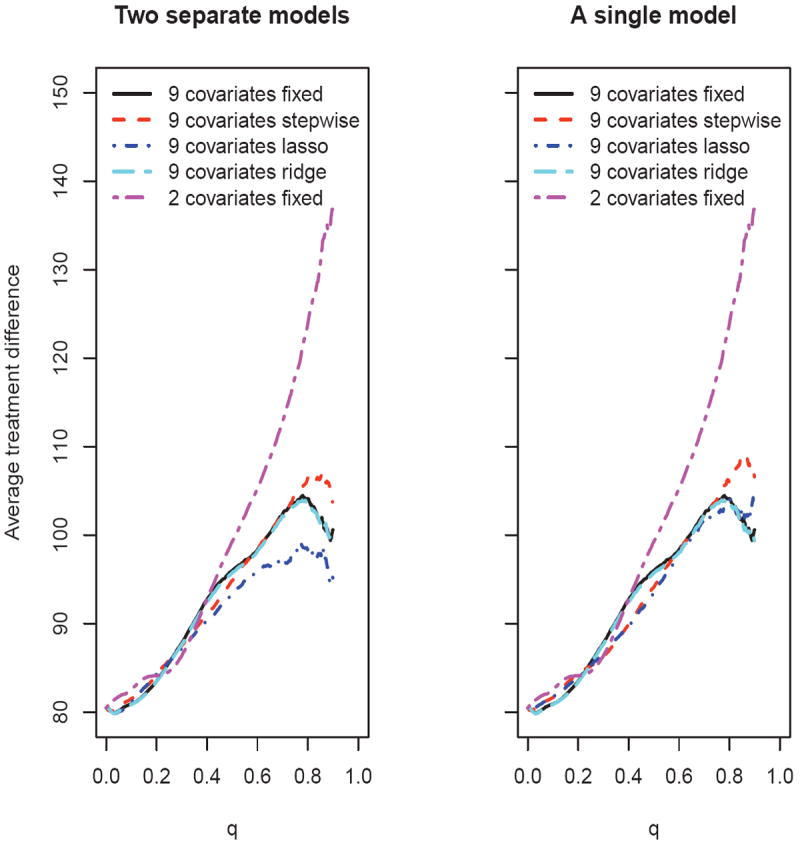
Comparing the estimated average treatment difference curves using various scoring systems based on 500 replicates of cross-validation for the ACTG 320 data (left panel: two separate models; right panel: a single interaction model)
Official websites use .gov
A
.gov website belongs to an official
government organization in the United States.
Secure .gov websites use HTTPS
A lock (
) or https:// means you've safely
connected to the .gov website. Share sensitive
information only on official, secure websites.
Comparing the estimated average treatment difference curves using various scoring systems based on 500 replicates of cross-validation for the ACTG 320 data (left panel: two separate models; right panel: a single interaction model)