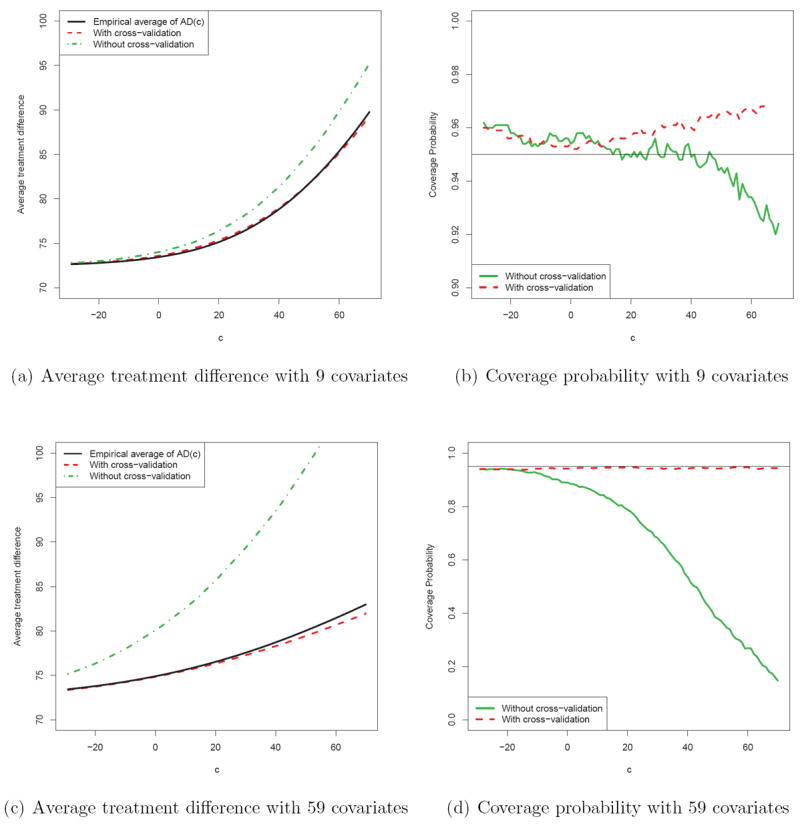
Figure 7.

Comparisons between the estimation procedures with and without cross-validation with n = 870; (a) and (b) are based on simulation with the 9 covariates mimicking the HIV example; (c) and (d) are based on simulation with the 9 covariates plus 50 noise variables. The (a) and (c) present the average treatment difference curves, the solid curve is the “truth”, the dashed curve is the empirical average using cross-validation procedure with a 4:1 ratio of training and evaluation samples, and the dotted curve is the empirical average without using cross-validation. In (b) and (d), the solid and dashed lines are the coverage probabilities of the 95% confidence intervals without and with cross-validation, respectively.
