
Figure 4.
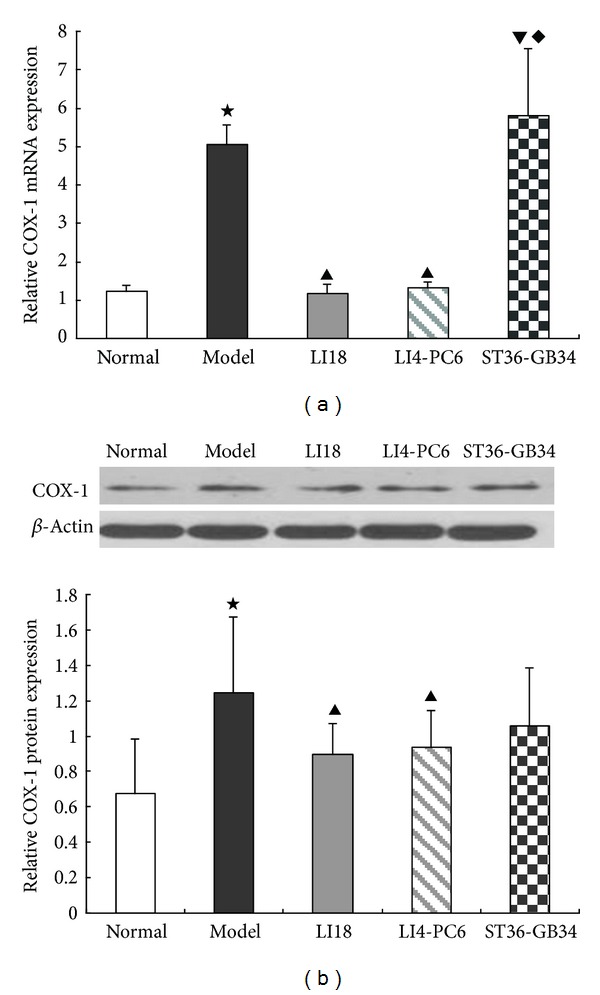
Effect of EA stimulation of different acupoints on COX-1 mRNA (a) and protein (b) expression 4 h after neck incision in rats. Data are expressed as mean ± SD (n = 7), (ANOVA, followed by LSD post hoc test); ⋆ P < 0.05, compared with the normal group, ▲ P < 0.05, compared with the model group; ▾ P < 0.05, compared with the LI18 group; ◆ P < 0.05, compared with the LI4-PC6 group.