Fig. 3.
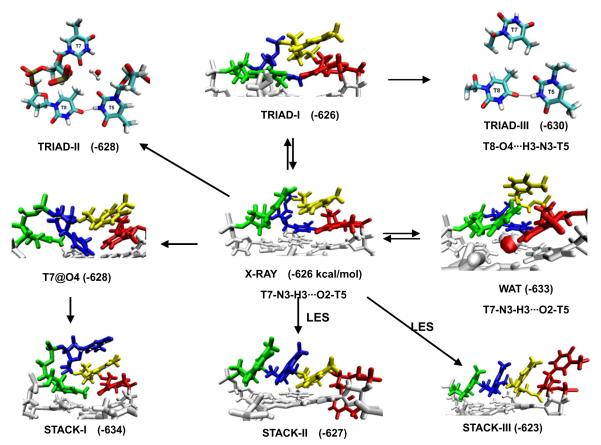
Diverse geometries of diagonal dT4 loop of the Oxytricha nova telomere G-DNA (G4T4G4)2 in MD simulations. The first to the last loop residues are shown in red, yellow, blue and green respectively. Free energy (in kcal/mol, MM-PBSA method) and hydrogen bonds within the loop are shown. The loop free energy was calculated as earlier [52]. The arrows show the directions of structural transitions observed during the MD simulations. LES denotes the simulations with the locally enhanced sampling method applied. The stable water molecules observed in the TRIAD-II and WAT geometries are also shown. In TRIAD-I, the last loop residue moved down to form stacking with terminal quartet, and the interactions between other loop residues are similar to the experimental geometry. In TRIAD-II and TRIAD-III, new h-bond formed between T5 and T8, and the original h-bond between T5 and T7 is broken. The conformation of T6 of triad-II and traid-III is similar to that of triad-I and is not shown for clarity. The experimental structure is definitely not reproduced and is often replaced by structures with enhanced base stacking, either between the thymines or with the terminal quartet.

