
Figure 6.
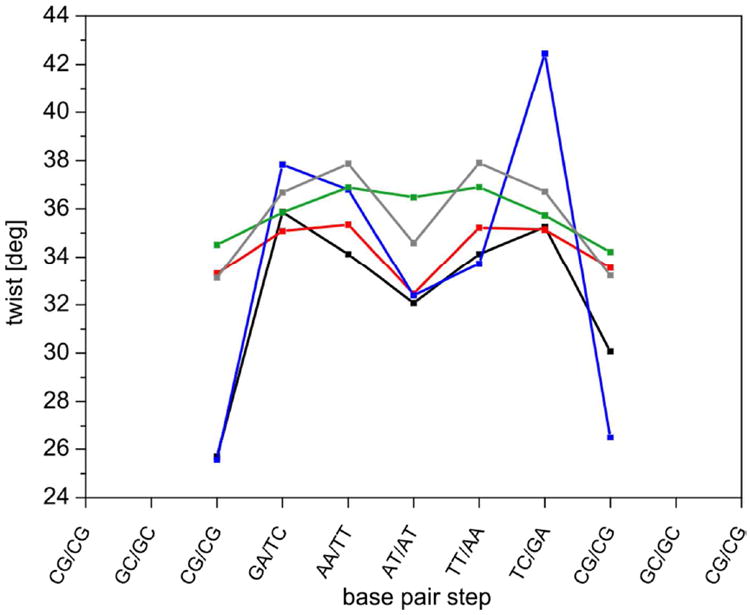
Twist values for individual base pair steps in the DD dodecamer. MD simulations with ff99bsc0 (black) and ff99bsc0εζOL (red) are compared with X-ray data (blue, 1FQ2), ensemble-refined NMR data27 (green) and NMR data with standard refinement72 (gray, average from 1NAJ structure). The last 800 ns of the 1 μs simulations were averaged and the last two terminal base pairs at each end were excluded from the analysis.