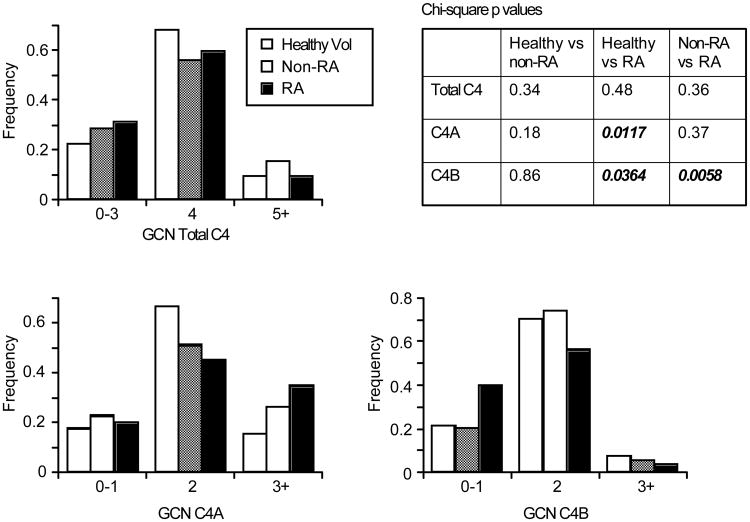
Figure 1. Distribution patterns of C4, C4A, and C4B gene copy number (GCN) among healthy controls, non-RA and RA patients.
Chi-square analysis show emboldened values for statistically significant differences in distribution of C4A (p=0.0117) and C4B (p=0.0364) in the healthy volunteers relative to RA populations. Between the Non-RA (n=88) and RA (n=160) populations, significant differences were only seen for C4B (p=0.0058).

