
Figure 4. MMSET regulates DNA end-joining and transcription of theIghswitch region. A.
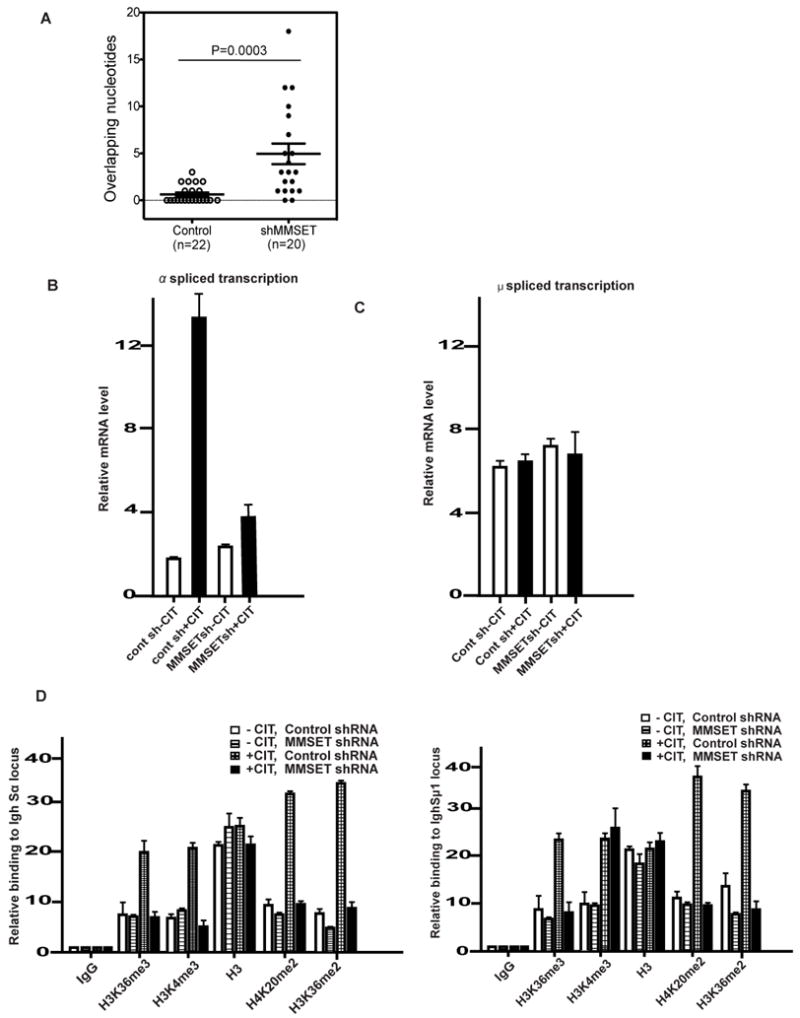
Effect of MMSET on microhomology of Cμ-Cα junctions. Percentage breakdown of clones based on the number of overlapping nucleotides (n=20 for MMSET depleted, n=22 for parental cells). B, RT-qPCR analysis of spliced Igh-Sα switch transcripts in CH12F3 B cells stimulated under the indicated conditions. Data are representative of three independent experiments. C, RT-qPCR analysis of spliced Igh-Sμ1 switch transcripts in CH12F3 B cells stimulated under the indicated conditions. Data are representative of three independent experiments. D, CH12F3 cells were transfected with the indicated shRNA and treated with or without CIT. ChIP analysis was then performed for the indicated histone modifications by the Sα primer (left panel) or Sμ1 primer (right panel) pair. The Y axis represents the relative enrichment of the indicated proteins compared to the IgG control. Data are representative of three independent experiments. (± s.e.m., n=3).