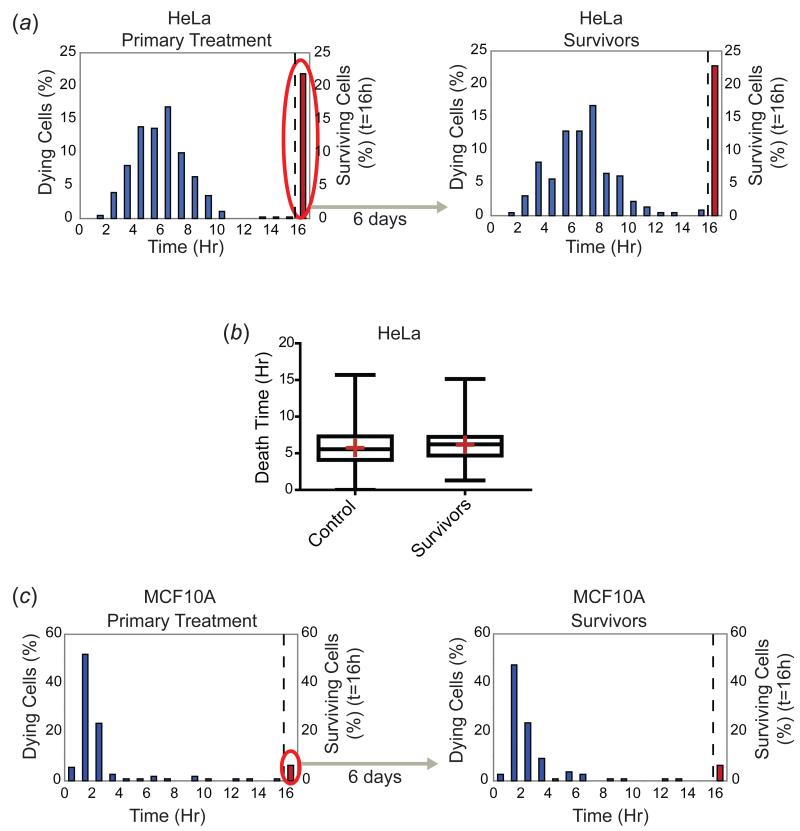
Figure 2. Survivor cells re-acquire sensitivity to TRAIL and regenerate the time of death distribution of the original cell population.
(a) HeLa cell survivors of a 16 hour TRAIL treatment (50ng/ml) (red bar and oval, left panel) were grown for six days in the absence of TRAIL and then re-treated with the same dose of TRAIL (right panel). The cells were imaged by live-cell microscopy and time of death was scored based on morphological changes associated with cell death. Death time distributions (blue bars) and the percentage of surviving cells at the 16h timepoint (red bars, right side of dotted line) are plotted for both the primary treatment and the treatment of survivor cells. (b) Quantitation of the death time distributions of primary treatment control (naïve) and survivor cells from (a) monitored on the same day. Cells surviving at the 16h timepoint are excluded from the analysis. Neither the mean (red crosses), median (lines through boxes), nor variances of the death times were significantly different (p>0.05 for unpaired Welch’s t-test for distribution means, Mann-Whitney test for medians of non-Gaussian distributions, F test for variances). At least 200 cells were analyzed for each sample. (c) Time of death distributions and percentage of surviving cells plotted for control (naïve) and survivor MCF10A cells (six days after the initial treatment), treated with 50ng/ml TRAIL for 16h and imaged by live-cell microscopy.

