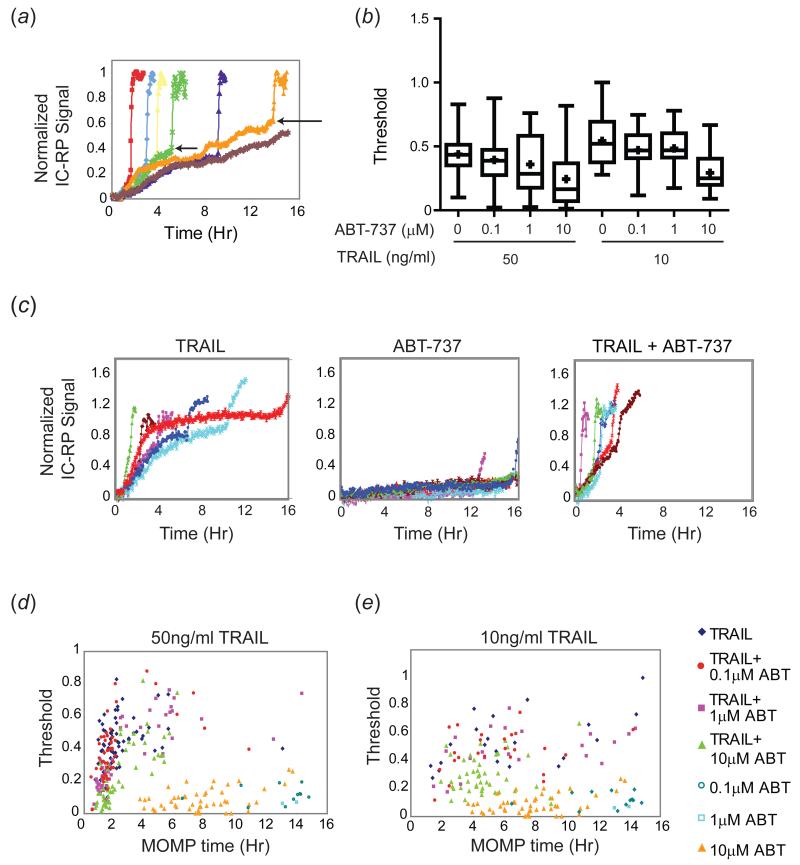
Figure 5. Bcl-2 inhibition lowers the threshold for cell death.
(a) Schematic illustrating sample IC-RP trajectories for individual HeLa cells (each indicated by a different color) treated with TRAIL (50ng/ml). Arrows indicate levels of IC-RP activity (threshold, y-axis) at the time of MOMP (x-axis) for two individual cells. (b) Box plots indicating the MOMP threshold (height of the IC-RP FRET trajectory at the time of MOMP) for a population of 50-100 HeLa cells treated with the indicated doses of TRAIL and ABT-737. Initiator caspase FRET trajectories for individual cells were normalized to the minimum and maximum intensity for each trajectory, and the threshold was calculated as the normalized intensity at the time of MOMP. Box plots span the entire range of the data. (c) IC-RP trajectories of representative individual HeLa cells treated with TRAIL (50ng/ml), ABT-737 (1μM), or TRAIL + ABT-737 for 16h and imaged for 16h by live-cell microscopy. (d-e) Dot plots showing the MOMP threshold plotted relative to time of MOMP for individual cells treated with the indicated doses of TRAIL and ABT-737.

