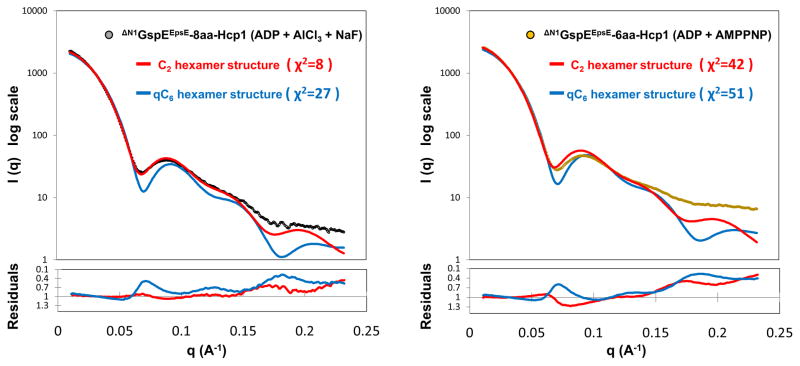
Figure 3. SAXS studies on ΔN1GspEEpsE-8aa-Hcp1 and ΔN1GspEEpsE-6aa-Hcp1.
Experimental (black and yellow circles) and calculated (red and blue) SAXS scattering curves for ΔN1GspEEpsE-8aa-Hcp1 and ΔN1GspEEpsE-6aa-Hcp1 with the same nucleotides as in the mother liquor of the crystal structures (See the right upper corner of each panel, and for specific details see methods). The calculated SAXS curve based on the ΔN1GspEEpsE-6aa-Hcp1 structure with the qC6 hexamer of ΔN1GspEEpsE shown in blue, and for the ΔN1GspEEpsE-8aa-Hcp1 structure with the C2 hexamer of ΔN1GspEEpsE shown in red. Residual plots are shown in the lower panels. See also Figure S9.

