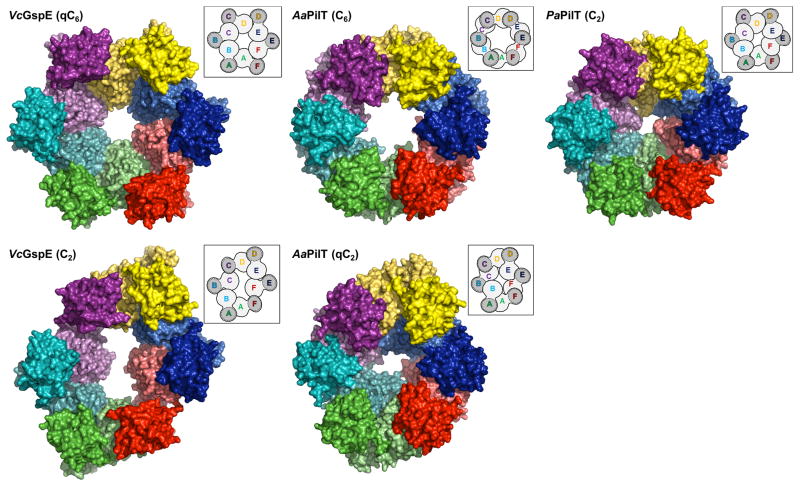
Figure 4. Comparison of T2SS GspEEpsE and T4PS secretion ATPases.
Figure 4A. The regular and irregular GspEEpsE and PilT hexamers.
NOTE: The N2D and CTD domains of the same subunit are represented with darker and lighter shades of the same color. Insets: Hexamers with the CTD•N2D’ construction units outlined
Top: comparison of regular hexamers. Left: V. cholerae ΔN1GspEEpsE qC6 hexamer. Middle: A. aeolicus PilT C6 hexamer (PDB: 2EWV). Right: P. aeruginosa PilT C2 hexamer (PDB: 3JVV).
Bottom: comparison of irregular hexamers. Left: V. cholerae ΔN1GspEEpsE C2 hexamer. Middle: A. aeolicus PilT qC2 hexamer (PDB: 2GSZ). See also Figure S5.
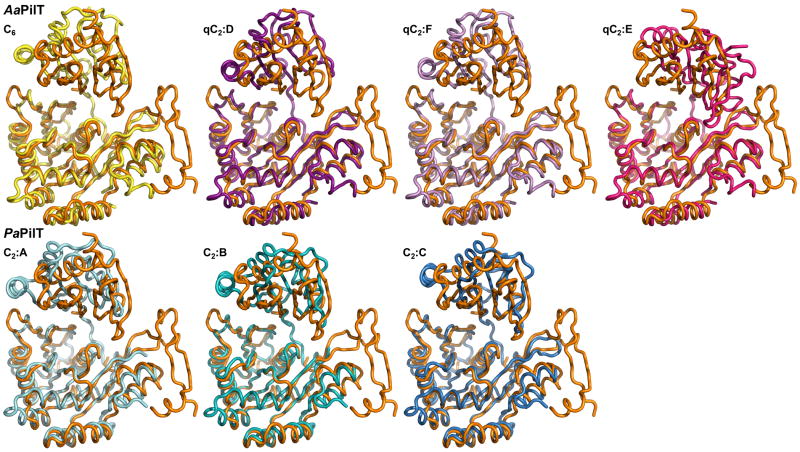
Figure 4B. The variability of the N2D-vs-CTD orientations in GspEEpsE and PilT hexamers.
Shown are superimposed subunits in the “canonical view” with the CTDs superimposed below and the N2Ds on top. For a different, “orthogonal view,” see Figure S6. For N2D-vs-CTD orientations see Table S1.
Top: superposition of the CTD from the subunit in the AaPilT C6 hexamer (yellow; PDB: 2EWV) and the three independent subunits of the AaPilT qC2 hexamer (different shades of purple; PDB: 2GSZ) onto subunit E from the ΔN1GspEEpsE qC6 hexamer (orange).
Bottom: superposition of the CTDs of PaPilT (different shades of blue; PDB: 3JVV) onto subunit E from the ΔN1GspEEpsE qC6 hexamer (orange). See also Figure S6 and S8.
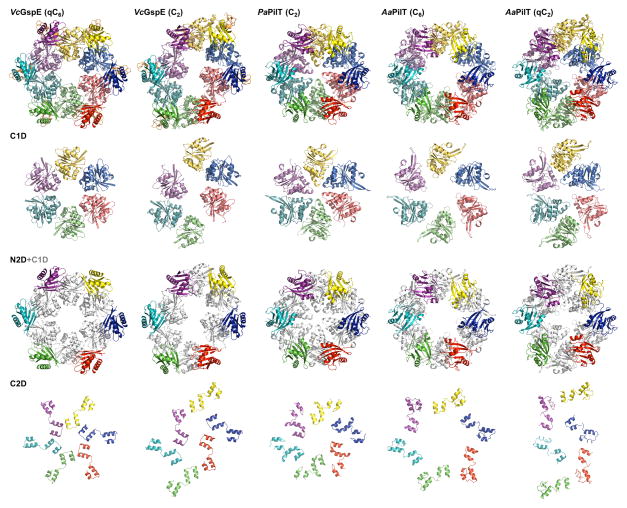
Figure 4C. Domain rearrangements of T2SS GspEEpsE and T4PS secretion ATPases.
Rows from top to bottom: hexamers; the C1Ds only; the N2Ds in color with C1Ds in grey as background; the C2Ds only. Note how different the domain positions are in the various hexamers.


