Figure 7.

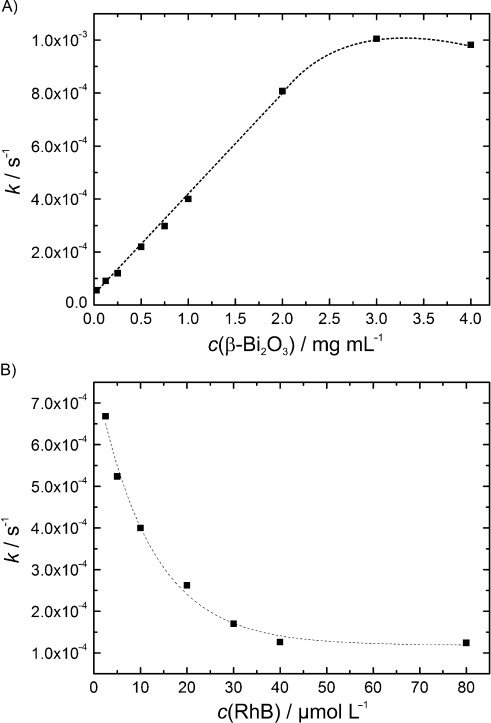
A) Plot of the rate constant versus the catalyst concentration (10−5 m RhB solution). B) Plot of the rate constant versus the initial RhB concentration (1.0 mg mL−1 β-Bi2O3-10).

A) Plot of the rate constant versus the catalyst concentration (10−5 m RhB solution). B) Plot of the rate constant versus the initial RhB concentration (1.0 mg mL−1 β-Bi2O3-10).