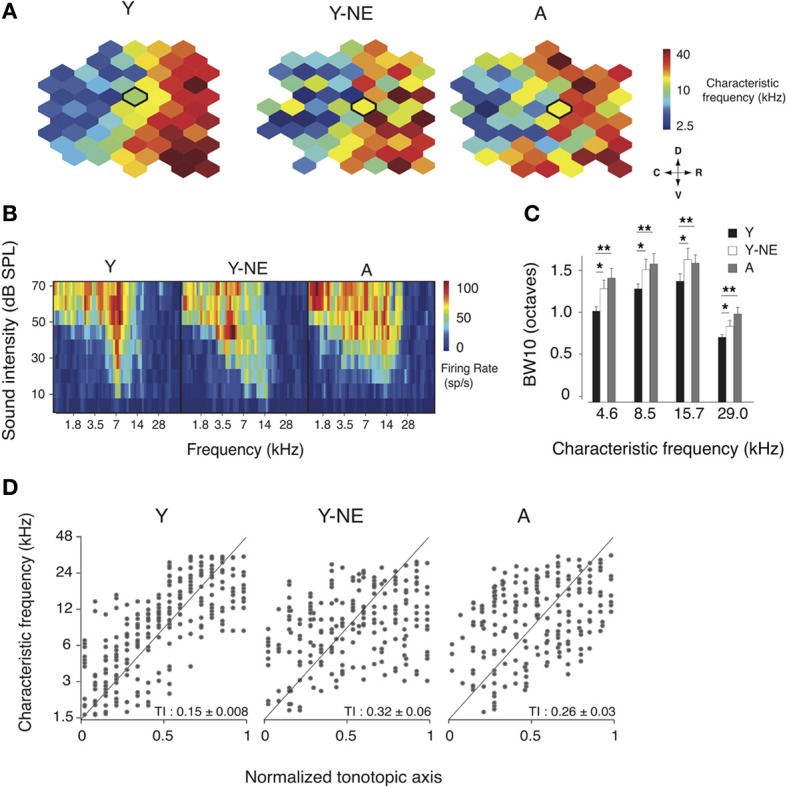
Figure 1.

Changes in frequency representation in the noise-exposed and aged A1. (A) Representative A1 CF maps from the young (Y), young noise-exposed (Y-NE) and aged (A) experimental groups. (B) Representative cortical receptive fields (RFs) obtained for the neurons recorded in the center of the bolded polygons in the respective maps shown in A. (C) Average BW10 for all neurons recorded in each group and separated by CF. (D) CF of A1 neurons plotted against position on the normalized tonotopic axis of the corresponding recorded cortical site (all cortical sites pooled for each group). The average tonotopic index (TI) calculated for each individual A1 maps is shown (see Methods). Y: n = 6, 317 neurons; Y-NE: n = 5, 246 neurons; A: n = 6, 295 neurons. *p < 0.05, **p < 0.01: t-test.
