Figure 4.
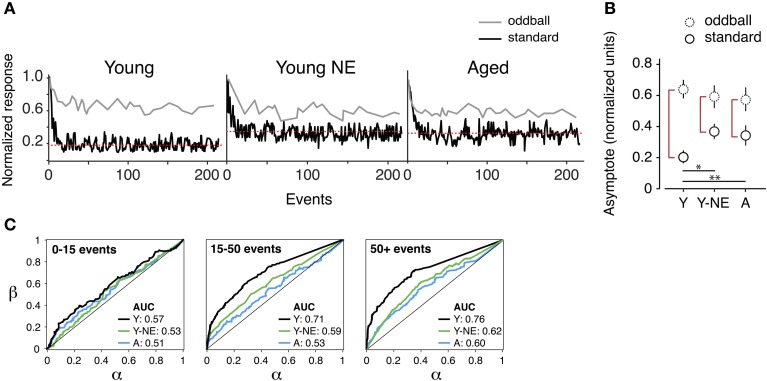
Reduced deviant tone detection by A1 neurons in the noise-exposed group. (A) Representative normalized responses of individual A1 neurons in the three experimental groups to standards (black line) and deviant tones or “oddballs” (gray line) as a function tone position in the stimulus sequence. The red dotted line represents the asymptote of the progressively suppressed response to standards. (B) Average asymptote computed for the response to oddballs and standards in all groups. Note the reduction in the difference between standards and oddball responses at steady state in the Y-NE and A groups (height of red vertical lines). (C) Average receiving operating characteristic curves computed from responses of individual neurons to oddball tone trains in all groups and for different time points in the tone sequence. AUC stands for “area under the curve.” Note that Y-NE and A groups do not reach the discrimination criterion (70%) (Y, number of neurons recorded = 275; Y-NE = 208; A = 245). *p < 0.05, **p < 0.01: t-test.

