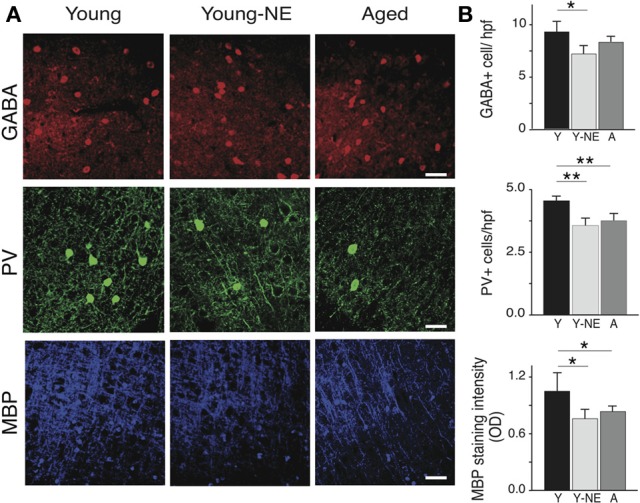
Figure 5.

Noise-induced changes in A1 PV+ interneurons and myelin. Quantitative analysis of the average number in A1 of GABA and PV immunoreactive cells per high power field (hpf) and myelin basic protein (MBP) immunoreactivity in all experimental groups. (A) Representative high power photomicrographs of representative sections in all groups. (B) Average PV+ and GABA+ cell counts and average MBP staining fluorescence optical density in all groups (all layers averaged). Note the relative decrease in PV+ cell count and MBP staining in Y-NE and A groups. Number of hemispheres examined: Y = 8, Y-NE = 8, A = 10. *p < 0.05, **p < 0.01: t-test. Scale bar: 50 μm.
