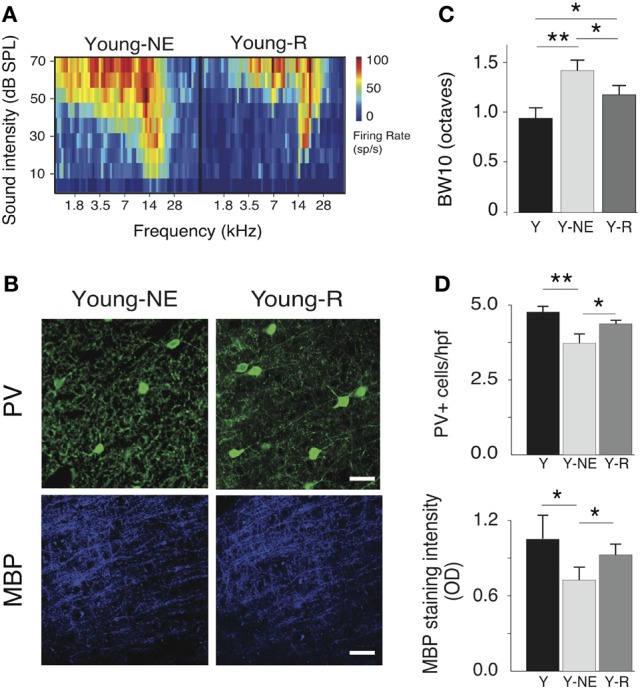
Figure 6.

Progressive recovery of A1 alterations after noise discontinuation. (A) Representative RFs of A1 neurons in the Y-NE and young recovered (Y-R) groups. (B), Average BW10 in Y-NE and Y-R groups (all recorded neurons pooled). (C), Representative high power photomicrographs showing immunoreactivity to PV and MBP in Y-NE and Y-R. (D), Quantitative analysis of the average number of PV+ cells and myelin density per high power field in all layers in the Y-R group, Y-NE and Y groups for comparison. Y: n = 6, neurons = 317; Y-NE: n = 5, neurons = 246, and Y-R: n = 4, neurons = 198. Number of hemispheres examined: Y = 8, Y-NE = 8, Y-R = 4. *p < 0.05, **p < 0.01. Scale bar: 50 μm.
