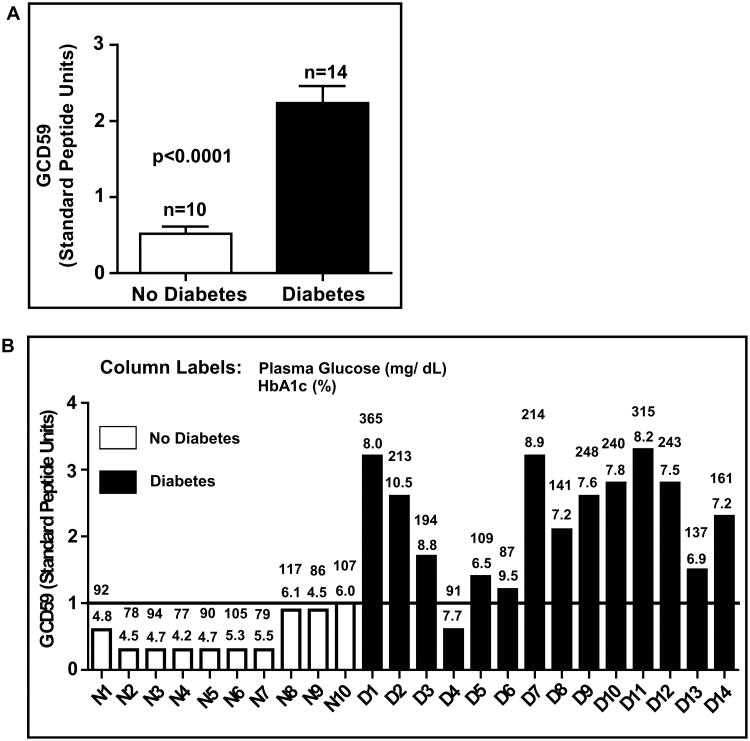
Figure 4. Higher levels of plasma GCD59 in individuals with as compared with individuals without diabetes.
A. Mean ± SEM of plasma GCD59 10 non-diabetic and 14 diabetic individuals.
B. Bar graph representation of the plasma GCD59 value in each study subject; the numbers above the bars represent fasting plasma glucose (top value) and HbA1c (bottom value) measured simultaneously with GCD59. In this cohort selected without any reference as to duration, treatment or control level of diabetes, a cut-off value of 1 SPU differentiates the cohorts without and with diabetes with 100 % specificity and 93% sensitivity.

