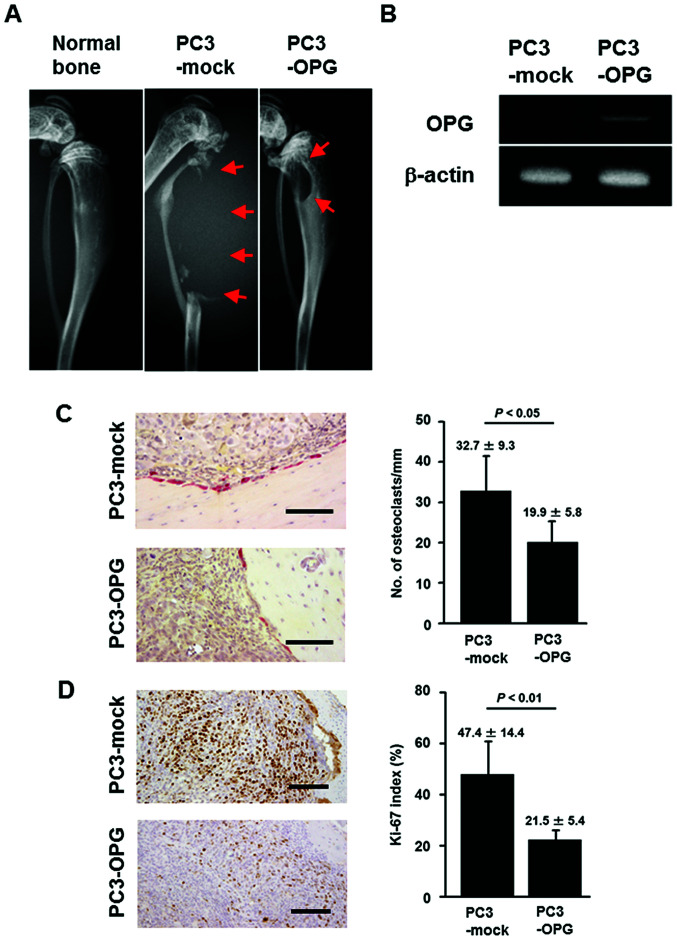
Figure 2.
Effect of OPG overexpression on the growth of prostate cancer cells in the bones of nude mice. (A) Representative X-ray radiographs of normal, PC3-mock- or PC3-OPG-injected tibial bones of nude mice at the end of 9 weeks. Red arrow, bone lesion. (B) By using a part of the tumor tissue (9 weeks after injection of PC3-mock and PC3-OPG cells, respectively), semi-quantitative RT-PCR was conducted for OPG and β-actin. (C) Formalin-fixed paraffin-embedded sections of bone lesions were subjected to TRAP staining and the number of osteoclasts (TRAP-positive cells) per mm of tumor-contacting bone were counted. Values are means ± SD. Images are representative TRAP-positive cells stained red. Scale bar, 100 μm. (D) Formalin-fixed paraffin-embedded sections of bone lesions were subjected to immunohistochemical staining using anti-Ki-67 antibody. Positive cells were counted and calculated to generate Ki-67 indices. Values are means ± SD. Images are representative Ki-67-stained cells. Scale bar, 200 μm.

