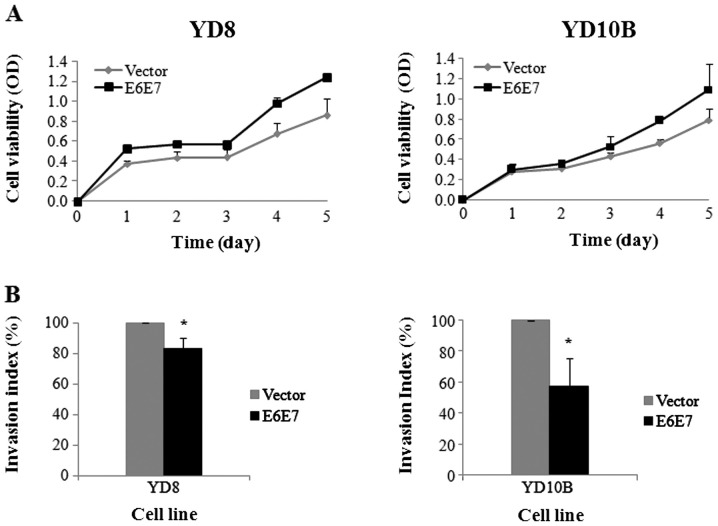
Figure 3.
The differences of cell viability and invasion activity in two transfected cell lines. Cell viability and cell invasion were significantly different between HPV16 E6E7 transfected cells (YD8, YD10B-E6E7) and vector-alone cells (YD8, YD10B-V). Cells transfected with HPV16 E6E7 were more viable than cells transfected with vector alone (A) and cells transfected with HPV16 E6E7 had reduced invasion activity compared cells transfected with vector alone (B). Cell viability rate was calculated as the percentage of MTS absorption as follows: % survival = (mean experimental absorbance/mean control absorbance) x 100. Invasion activity was presented as the invasion index. The mean and standard deviation of the invasion index were then calculated. Each experiment was performed in triplicates. Data represent the mean ± SD. Statistically significant differences between the control and treatment groups are presented as *P<0.05.

