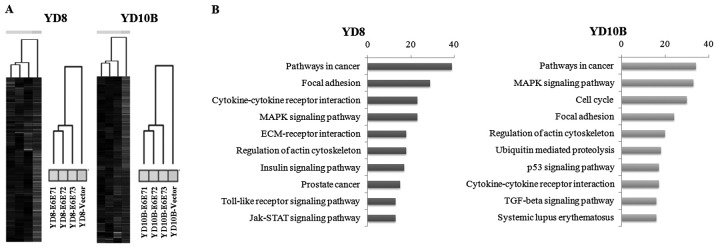
Figure 4.
The gene expression profile in HPV E6E7 transfected cells. Two-dimensional hierarchical clustering analysis of expression profiling in cells transfected with HPV16 E6E7 compares with cells transfected with vector alone. To identify genes altered by HPV, fold-change analysis was applied. (A) Dendrogram cluster of YD8 cells, showing two clusters according to the expression profiles of the 1,079 classifier genes selected by applying expression change cut-off of 2-fold. Dendrogram cluster of YD10B cells, showing two clusters according to the expression profiles of the 2,414 classifier genes. (B) Functional classification of differentially expressed genes using categories defined as part of the KEGG pathway database. Pathway list of genes that are differentially expressed in cells transfected with HPV16 E6E7 and cells transfected with vector alone (P<0.05).

