Figure 1.
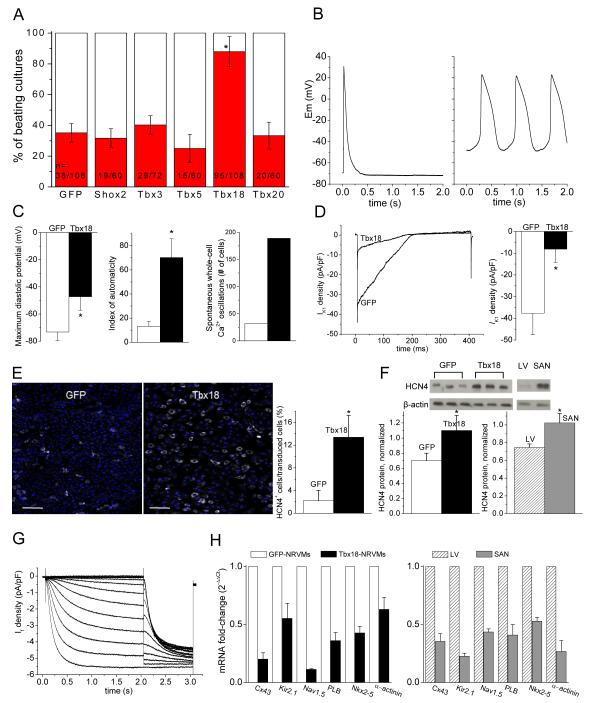
Tbx18-transduced NRVMs become spontaneously beating cardiomyocytes. A. Tbx18-transduction significantly increases the number of spontaneously beating NRVM cultures compared to control and to several other transcription factors (Shox2, Tbx3, Tbx5 and Tbx20). Each n represents one well of a 24-well plate. More than five different cell batches (each batch comprising three litters of neonatal rat hearts) were examined. B. Representative action potential (AP) traces from GFP-(1B. left) and Tbx18-NRVMs (1B, right). Most GFP-NRVMs (7 of 9) were quiescent and fired an AP only after stimulation. In contrast, most Tbx18-NRVMs (7 of 9) exhibited spontaneous APs with prominent gradual phase-4 depolarization. C. Maximum diastolic potential, index of automaticity, and the total cell number of spontaneously-oscillating Ca2+ transients are summarized. Among the Tbx18-NRVMs, 73.8 ± 6.0% of the transduced cells beat spontaneously compared to 28.8 ± 6.1% in GFP-NRVMs (p <0.05). The beating rates of Tbx18-NRVMs were 95 ± 23 bpm compared to 46 ± 10 bpm of GFP-NRVMs (p <0.05). GFP- and Tbx18-groups are indicated by white and black bars, respectively, throughout the paper. D. Left: representative IK1 raw traces (GFP, black trace; Tbx18, blue trace) elicited by a ramp protocol from −140 to −20 mV. The summarized IK1 densities at −140 mV are shown in 1D right. E. HCN4 immunostaining image (HCN4-white, nuclei-blue) of GFP- or Tbx18-NRVMs are shown in left and middle, respectively. Scale bar: 200μm. Right panel: summary of the percent HCN4-positive cells per GFP- or Tbx18-transduced cells. F. Western blot indicates higher HCN4 protein level in Tbx18-NRVMs relative to control (left) comparable to the level HCN4 observed in adult rat SAN (right panel, n=3 samples). G. Tbx18-NRVMs exhibited robust If recorded in the presence of 2 mM Ba2+ to eliminate contaminating IK1. H. Changes of relative mRNA levels of selected genes comparing Tbx18-NRVMs normalized to GFP-NRVMs (left) and SAN normalized to LV (right). SAN and Tbx18-NRVMs demonstrate similar pattern of normalized transcript levels (n=3 RT-PCR reactions, each reaction was performed with cells isolated from ≥4 wells from a 6-well plate).

