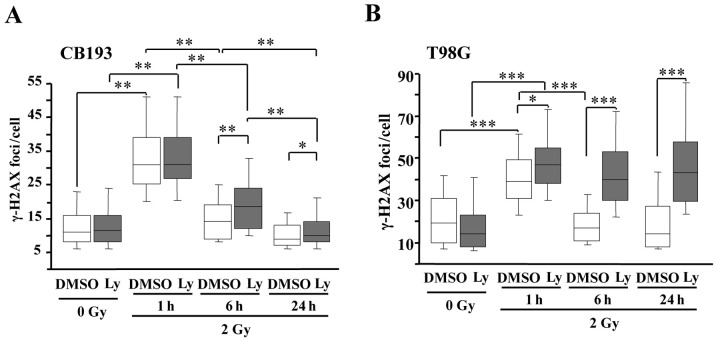
Figure 3.
Ly-294002 delays diversely the DNA repair in T98G and CB193. Box graphs showing the distribution of γ-H2AX foci per cell in CB193 (A) and in T98G (B) cells 1, 6 and 24 h after irradiation (200–400 nuclei analyzed per condition). Boxes include 50% of the values centered on the median (the horizontal line through the box). The vertical lines begin at the 10th percentile and end at the 90th percentile. Results are representative of two independent experiments. More than 200 nuclei per condition in at least three different fields were counted. Statistics (t-test): *P<0.05; **P<0.01; ***P<0.001.

