
Figure 4. Phase 2 cross-validation decoding of cued and uncued visual information.
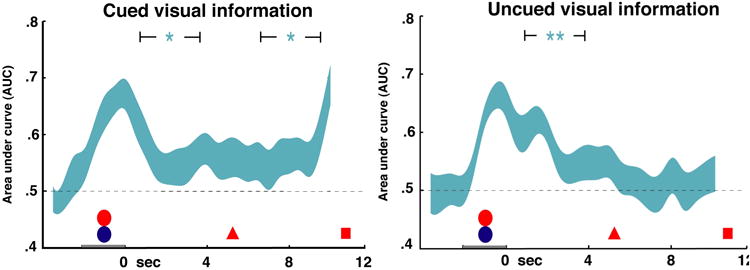
Cross-validation decoding was performed within the Phase 2 task. Classifier sensitivity to the visual category (AUC) is plotted for each k-fold cross validation analysis time window, averaged across subjects. The width of the ribbon corresponds to the standard error of the AUC, calculated across subjects. Width of brackets surrounding significance markers indicates extent of delay period used for statistical analysis – see methods for details. Time is represented on the horizontal axis, with stimulus presentation (circles) from -2 to 0 s, the first cue (triangle) at 5 s, and the first probe (square) at 10.5 s. *p<0.05, **p<0.005.