


Figure 6.
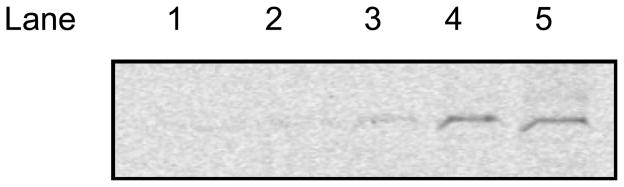
In-gel fluorescence SDS-Page analysis of HEK 293T cells over-expressing Flag-tagged p38α treated with 3 and then subjected to lysis, immunoprecipitation, and click reaction with Alexa594-azide. Lane 1. Cells treated with vehicle (0.05 % DMSO); 2. Cells treated with 1 μM 3. Lane 3. Cells treated with 5 μM 3. Lane 4. Cells treated with 50 μM 3. Lane 5. Isolated flag-tagged p38α (~0.6 μg) treated with 50 μM 3 in vitro followed by click reaction.