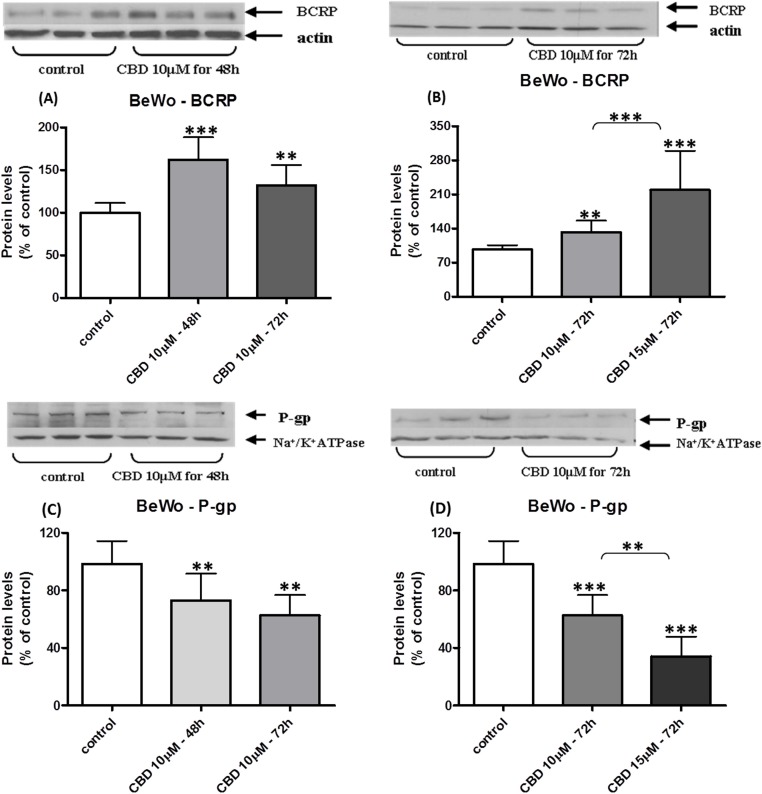
Figure 2. Long-term exposure of BeWo cells to CBD: changes in P-gp and BCRP protein levels.
Long-term exposure of BeWo cells to CBD: changes in membrane BCRP and P-gp expressed levels. Changes in BCRP-CBD concentration-dependent (B) and time-dependent (A). Changes in P-gp-CBD concentration-dependent (D) and time-dependent (C). No statistical significance between 48 and 72 h time points. Data is displayed in means ± s.d. of at least three (n = 9) independent experiments of each concentration or time point. One representative blot is presented for each experimental group. One-Way ANOVA, followed by Bonferroni’s multiple comparison test, ∗∗p < 0.01, ∗∗∗p < 0.0001 compared to control or comparison between groups as indicated.

